Key Takeaways
- China's power battery installations rose 18.2% year-on-year in October, ending a 2-month streak of slowing growth.
- Lithium iron phosphate battery installations reached 86.3 GWh, with market share rising to a record 86.9%.
China's power battery installations reached a record high in October, with year-on-year growth rebounding from a slowdown in September as lithium iron phosphate (LFP) batteries strengthened their market dominance.
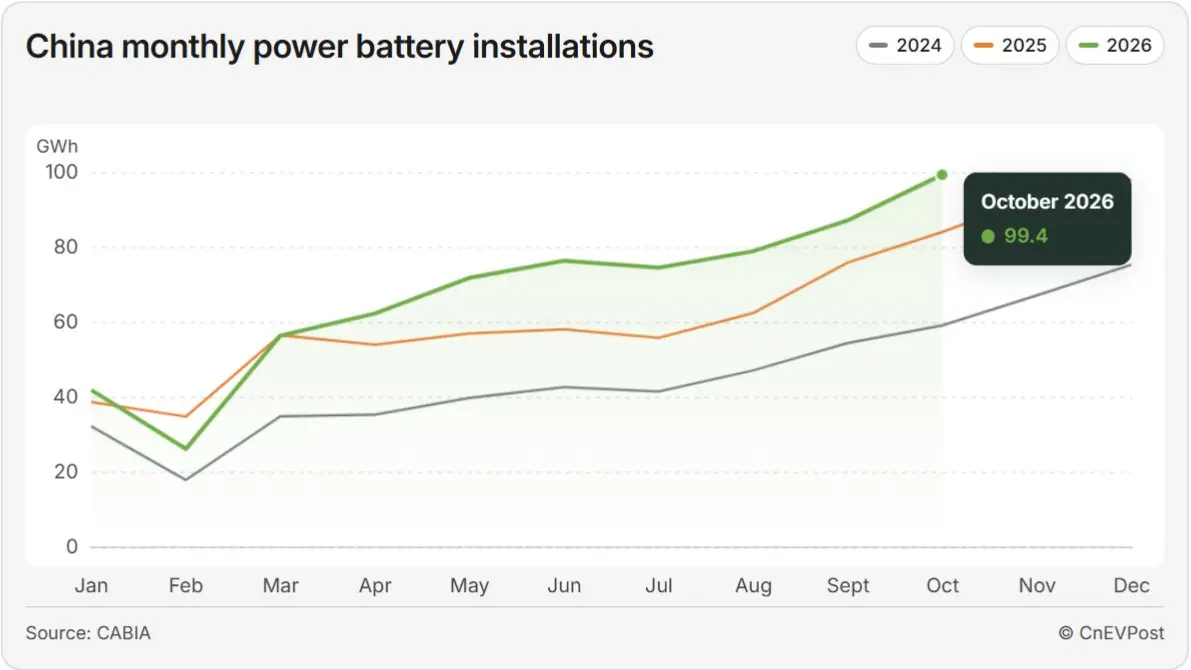
Domestic power battery installations totaled 99.4 GWh in October, up 18.2% year-on-year and 14.0% month-on-month, according to data released on Thursday by the China Automotive Battery Innovation Alliance (CABIA).
The figure surpassed the previous all-time monthly high of 98.1 GWh set in December 2025, marking the third consecutive month to set a new high for the year, according to data compiled by CnEVPost.
Year-on-year growth in October installations accelerated from 14.7% in September, ending a 2-month streak of slowing expansion.
LFP battery installations reached a record 86.3 GWh in October, jumping 27.8% year-on-year and 15.8% month-on-month.
LFP batteries accounted for 86.9% of total installations in October, up from 85.5% in September and surpassing the previous record of 85.6% set in August this year.
| Month | Ternary (GWh) | LFP (GWh) |
|---|---|---|
| Jan 2020 | 1.6 | 0.7 |
| Feb 2020 | 0.5 | 0.1 |
| Mar 2020 | 2.2 | 0.5 |
| Apr 2020 | 2.6 | 0.9 |
| May 2020 | 2.7 | 0.8 |
| Jun 2020 | 3.0 | 1.7 |
| Jul 2020 | 3.3 | 1.7 |
| Aug 2020 | 3.5 | 1.6 |
| Sept 2020 | 4.2 | 2.3 |
| Oct 2020 | 3.4 | 2.4 |
| Nov 2020 | 5.9 | 4.7 |
| Dec 2020 | 6.0 | 6.9 |
| Jan 2021 | 5.4 | 3.3 |
| Feb 2021 | 3.3 | 2.2 |
| Mar 2021 | 5.1 | 3.9 |
| Apr 2021 | 5.2 | 3.2 |
| May 2021 | 5.2 | 4.5 |
| Jun 2021 | 5.9 | 5.1 |
| Jul 2021 | 5.5 | 5.8 |
| Aug 2021 | 5.3 | 7.2 |
| Sept 2021 | 6.1 | 9.5 |
| Oct 2021 | 7.0 | 8.4 |
| Nov 2021 | 9.2 | 11.6 |
| Dec 2021 | 11.1 | 15.1 |
| Jan 2022 | 7.3 | 8.9 |
| Feb 2022 | 5.8 | 7.8 |
| Mar 2022 | 8.2 | 13.2 |
| Apr 2022 | 4.4 | 8.9 |
| May 2022 | 8.3 | 10.2 |
| Jun 2022 | 11.6 | 15.4 |
| Jul 2022 | 9.8 | 14.3 |
| Aug 2022 | 10.5 | 17.2 |
| Sept 2022 | 11.2 | 20.4 |
| Oct 2022 | 10.8 | 19.7 |
| Nov 2022 | 11.0 | 23.1 |
| Dec 2022 | 11.4 | 24.7 |
| Jan 2023 | 5.4 | 10.7 |
| Feb 2023 | 6.7 | 15.2 |
| Mar 2023 | 8.7 | 19.0 |
| Apr 2023 | 8.0 | 17.1 |
| May 2023 | 9.0 | 19.2 |
| Jun 2023 | 10.1 | 22.7 |
| Jul 2023 | 10.6 | 21.7 |
| Aug 2023 | 10.8 | 24.1 |
| Sept 2023 | 12.2 | 24.2 |
| Oct 2023 | 12.3 | 26.8 |
| Nov 2023 | 15.7 | 29.1 |
| Dec 2023 | 16.6 | 31.3 |
| Jan 2024 | 12.6 | 19.7 |
| Feb 2024 | 6.9 | 11.0 |
| Mar 2024 | 11.3 | 23.6 |
| Apr 2024 | 9.9 | 25.5 |
| May 2024 | 10.4 | 29.5 |
| Jun 2024 | 11.1 | 31.7 |
| Jul 2024 | 11.4 | 30.1 |
| Aug 2024 | 12.1 | 35.0 |
| Sept 2024 | 13.1 | 41.3 |
| Oct 2024 | 12.2 | 47.0 |
| Nov 2024 | 13.6 | 53.6 |
| Dec 2024 | 14.3 | 61.0 |
| Jan 2025 | 8.5 | 30.2 |
| Feb 2025 | 6.4 | 28.4 |
| Mar 2025 | 10.0 | 46.6 |
| Apr 2025 | 9.3 | 44.8 |
| May 2025 | 10.5 | 46.5 |
| Jun 2025 | 10.7 | 47.4 |
| Jul 2025 | 10.9 | 44.9 |
| Aug 2025 | 10.9 | 51.6 |
| Sept 2025 | 13.8 | 62.2 |
| Oct 2025 | 16.5 | 67.5 |
| Nov 2025 | 18.2 | 75.3 |
| Dec 2025 | 18.2 | 79.8 |
| Jan 2026 | 9.4 | 32.7 |
| Feb 2026 | 5.7 | 20.6 |
| Mar 2026 | 10.7 | 45.8 |
| Apr 2026 | 11.5 | 50.8 |
| May 2026 | 13.4 | 58.4 |
| Jun 2026 | 12.7 | 63.7 |
| Jul 2026 | 11.1 | 63.1 |
| Aug 2026 | 11.0 | 67.6 |
| Sept 2026 | 12.3 | 74.5 |
| Oct 2026 | 12.8 | 86.3 |
Ternary battery installations stood at 12.8 GWh in October, down 22.8% year-on-year, though they rose 3.8% month-on-month to mark a second consecutive monthly increase.
The market share of ternary batteries fell to 12.9% for the month, down from 14.1% in September and hitting the lowest monthly level on record.
From January to October, China's cumulative domestic power battery installations totaled 675.6 GWh, up 16.9% year-on-year, slightly faster than the 16.7% growth recorded in the first 9 months.
Cumulative LFP battery installations reached 563.5 GWh in the first 10 months, up 19.9% year-on-year and accounting for 83.4% of the total. Cumulative ternary battery installations rose 2.7% year-on-year to 110.6 GWh, representing a 16.4% share.
Alongside rising installations, China's combined output of power and energy storage batteries hit a record 245.1 GWh in October, up 43.6% year-on-year and 3.0% month-on-month. Cumulative output in the first 10 months reached 2,078.1 GWh, surging 60.8% year-on-year.
| Month | 2024 | 2025 | 2026 |
|---|---|---|---|
| Jan | 65.2 | 107.8 | 168 |
| Feb | 43.6 | 100.3 | 141.6 |
| Mar | 75.8 | 118.3 | 177.7 |
| Apr | 78.2 | 118.2 | 183.9 |
| May | 82.7 | 123.5 | 191.7 |
| Jun | 84.5 | 129.2 | 206 |
| Jul | 91.8 | 133.8 | 218 |
| Aug | 101.3 | 139.6 | 237 |
| Sept | 111.3 | 151.2 | 237.8 |
| Oct | 113.1 | 170.6 | 245.1 |
| Nov | 117.8 | 176.3 | |
| Dec | 124.5 | 201.7 |
| Month | Ternary (GWh) | LFP (GWh) |
|---|---|---|
| Jan 2020 | 0.37 | 0.46 |
| Feb 2020 | 0.50 | 0.40 |
| Mar 2020 | 3.20 | 1.20 |
| Apr 2020 | 2.90 | 1.80 |
| May 2020 | 3.10 | 2.10 |
| Jun 2020 | 3.10 | 2.20 |
| Jul 2020 | 3.30 | 2.80 |
| Aug 2020 | 4.40 | 3.00 |
| Sept 2020 | 4.80 | 3.80 |
| Oct 2020 | 5.50 | 4.30 |
| Nov 2020 | 7.30 | 5.40 |
| Dec 2020 | 8.50 | 6.50 |
| Jan 2021 | 6.80 | 5.20 |
| Feb 2021 | 5.10 | 4.30 |
| Mar 2021 | 5.80 | 5.40 |
| Apr 2021 | 6.70 | 6.20 |
| May 2021 | 5.00 | 8.80 |
| Jun 2021 | 7.40 | 7.80 |
| Jul 2021 | 8.00 | 9.30 |
| Aug 2021 | 8.40 | 11.10 |
| Sept 2021 | 9.60 | 13.50 |
| Oct 2021 | 9.20 | 15.90 |
| Nov 2021 | 10.40 | 17.80 |
| Dec 2021 | 11.40 | 20.10 |
| Jan 2022 | 10.80 | 18.80 |
| Feb 2022 | 11.60 | 20.10 |
| Mar 2022 | 15.60 | 23.60 |
| Apr 2022 | 10.30 | 18.60 |
| May 2022 | 16.30 | 19.20 |
| Jun 2022 | 18.30 | 22.90 |
| Jul 2022 | 16.60 | 30.60 |
| Aug 2022 | 19.30 | 30.80 |
| Sept 2022 | 24.30 | 34.80 |
| Oct 2022 | 24.20 | 38.60 |
| Nov 2022 | 24.20 | 39.10 |
| Dec 2022 | 18.50 | 33.90 |
| Jan 2023 | 12.42 | 26.38 |
| Feb 2023 | 14.57 | 30.49 |
| Mar 2023 | 18.20 | 32.90 |
| Apr 2023 | 17.60 | 29.30 |
| May 2023 | 18.60 | 37.80 |
| Jun 2023 | 17.70 | 42.20 |
| Jul 2023 | 20.40 | 40.50 |
| Aug 2023 | 23.13 | 50.30 |
| Sept 2023 | 25.30 | 51.90 |
| Oct 2023 | 23.60 | 53.60 |
| Nov 2023 | 27.80 | 59.80 |
| Dec 2023 | 25.00 | 52.50 |
| Jan 2024 | 22.70 | 42.40 |
| Feb 2024 | 14.80 | 28.60 |
| Mar 2024 | 24.20 | 51.40 |
| Apr 2024 | 22.70 | 55.40 |
| May 2024 | 22.00 | 60.50 |
| Jun 2024 | 20.50 | 63.80 |
| Jul 2024 | 23.00 | 68.50 |
| Aug 2024 | 24.80 | 76.30 |
| Sept 2024 | 27.00 | 84.20 |
| Oct 2024 | 23.50 | 89.50 |
| Nov 2024 | 24.20 | 93.40 |
| Dec 2024 | 26.00 | 98.10 |
| Jan 2025 | 20.70 | 87.00 |
| Feb 2025 | 19.30 | 80.90 |
| Mar 2025 | 23.80 | 94.30 |
| Apr 2025 | 23.50 | 94.60 |
| May 2025 | 27.20 | 96.10 |
| Jun 2025 | 29.50 | 99.50 |
| Jul 2025 | 29.50 | 104.10 |
| Aug 2025 | 30.90 | 108.60 |
| Sept 2025 | 31.50 | 119.40 |
| Oct 2025 | 33.70 | 136.70 |
| Nov 2025 | 36.40 | 139.60 |
| Dec 2025 | 40.60 | 160.50 |
| Jan 2026 | 31.30 | 136.70 |
| Feb 2026 | 26.90 | 114.60 |
| Mar 2026 | 31.30 | 146.20 |
| Apr 2026 | 31.60 | 152.30 |
| May 2026 | 35.60 | 155.80 |
| Jun 2026 | 36.60 | 169.20 |
| Jul 2026 | 38.20 | 179.40 |
| Aug 2026 | 41.20 | 195.30 |
| Sept 2026 | 35.00 | 202.40 |
| Oct 2026 | 31.70 | 213.10 |
Combined sales of power and energy storage batteries totaled 230.4 GWh in October, up 38.8% year-on-year and 3.4% month-on-month.
Power battery sales reached 159.3 GWh, up 28.1% year-on-year and accounting for 69.1% of total sales. Energy storage battery sales jumped 70.5% year-on-year to 71.1 GWh, making up 30.9% of the total.
In the first 10 months of the year, cumulative sales of the 2 battery categories rose 55.1% year-on-year to 1,912.1 GWh. Cumulative power battery sales grew 36.8% year-on-year to 1,245.6 GWh, while energy storage battery sales surged 106.5% year-on-year to 666.4 GWh.
China's combined exports of power and energy storage batteries hit a record 46.1 GWh in October, up 63.4% year-on-year and 4.8% month-on-month, accounting for 20.0% of total monthly sales.
Power battery exports totaled 29.0 GWh in October, up 49.4% year-on-year and 2.2% month-on-month, representing 62.9% of total exports. Energy storage battery exports surged 94.4% year-on-year and 9.7% month-on-month to 17.1 GWh, accounting for 37.1% of the total.
| Month | Ternary (GWh) | LFP (GWh) |
|---|---|---|
| Jan 2023 | 5.4 | 2.6 |
| Feb 2023 | 6.6 | 2.8 |
| Mar 2023 | 6.8 | 2.0 |
| Apr 2023 | 6.5 | 2.3 |
| May 2023 | 7.6 | 3.7 |
| Jun 2023 | 6.6 | 3.3 |
| Jul 2023 | 7.2 | 3.9 |
| Aug 2023 | 6.8 | 3.7 |
| Sept 2023 | 8.3 | 2.5 |
| Oct 2023 | 7.4 | 4.0 |
| Nov 2023 | 8.2 | 4.7 |
| Dec 2023 | 9.6 | 4.3 |
| Jan 2024 | 3.9 | 4.2 |
| Feb 2024 | 4.7 | 3.3 |
| Mar 2024 | 6.1 | 5.6 |
| Apr 2024 | 6.3 | 2.6 |
| May 2024 | 6.3 | 3.4 |
| Jun 2024 | 8.3 | 4.8 |
| Jul 2024 | 5.9 | 3.5 |
| Aug 2024 | 7.7 | 3.3 |
| Sept 2024 | 8.2 | 3.4 |
| Oct 2024 | 7.3 | 3.4 |
| Nov 2024 | 8.5 | 3.9 |
| Dec 2024 | 7.7 | 5.0 |
| Jan 2025 | 6.8 | 4.3 |
| Feb 2025 | 7.5 | 5.3 |
| Mar 2025 | 8.8 | 5.0 |
| Apr 2025 | 8.7 | 5.6 |
| May 2025 | 7.2 | 6.2 |
| Jun 2025 | 9.0 | 6.8 |
| Jul 2025 | 8.4 | 6.2 |
| Aug 2025 | 8.7 | 6.3 |
| Sept 2025 | 10.7 | 6.8 |
| Oct 2025 | 11.5 | 7.9 |
| Nov 2025 | 11.7 | 9.4 |
| Dec 2025 | 9.2 | 9.8 |
| Jan 2026 | 9.7 | 8.0 |
| Feb 2026 | 9.2 | 7.6 |
| Mar 2026 | 11.3 | 10.8 |
| Apr 2026 | 9.4 | 10.7 |
| May 2026 | 8.6 | 11.4 |
| Jun 2026 | 11.5 | 13.9 |
| Jul 2026 | 9.3 | 14.6 |
| Aug 2026 | 10.3 | 14.3 |
| Sept 2026 | 13.3 | 15.0 |
| Oct 2026 | 13.5 | 15.4 |
From January to October, cumulative exports of the 2 battery categories reached 349.0 GWh, up 53.0% year-on-year and accounting for 18.3% of cumulative sales. Cumulative power battery exports rose 54.0% year-on-year to 228.7 GWh, while energy storage battery exports grew 51.3% year-on-year to 120.3 GWh.
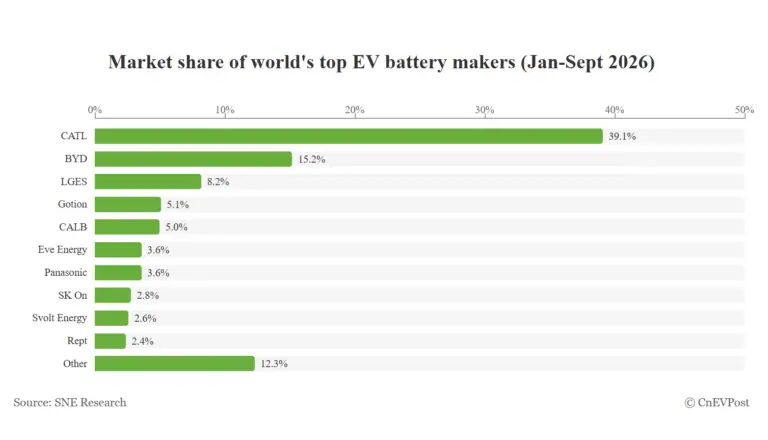
Global EV battery market share in January-September 2026: CATL 39.1%, BYD 15.2% - CnEVPostThe 7 Chinese companies in the top 10 held a combined 73.0% share of the global EV battery market, up 3.5 percentage points from a year earlier.