Aditya Aladangady, Jesse Bricker, Andrew C. Chang, Sarena Goodman, and Gina Li, with assistance from Payton Crawford1
Introduction
Precise estimates of marginal propensities to consume (MPCs) are central to understanding economic activity and the effects of economic shocks on households. However, the literature does not yield a consensus on either an aggregate MPC or the extent to which MPCs vary across the population.
To advance this literature, we, along with other members of the Federal Reserve staff, introduced a new question to the 2025 Survey of Consumer Finances (SCF) that directly elicits households' MPCs. Specifically, after respondents provide a detailed accounting of their income over the previous calendar year, they are asked how they would allocate, over the next year, a hypothetical windfall equal to one month of their normal income between spending (their MPC), saving, and paying down debt. The SCF includes high-income and high-wealth households often missing from other data sources, meaning that MPCs can be evaluated across the entire income and wealth distribution, including, importantly, at the top. The breadth of the SCF also enables heterogeneity analysis across household types emphasized in the literature, including those varying in liquidity, income uncertainty, and financial literacy. This note previews key results that will be expanded upon in a subsequent working paper.
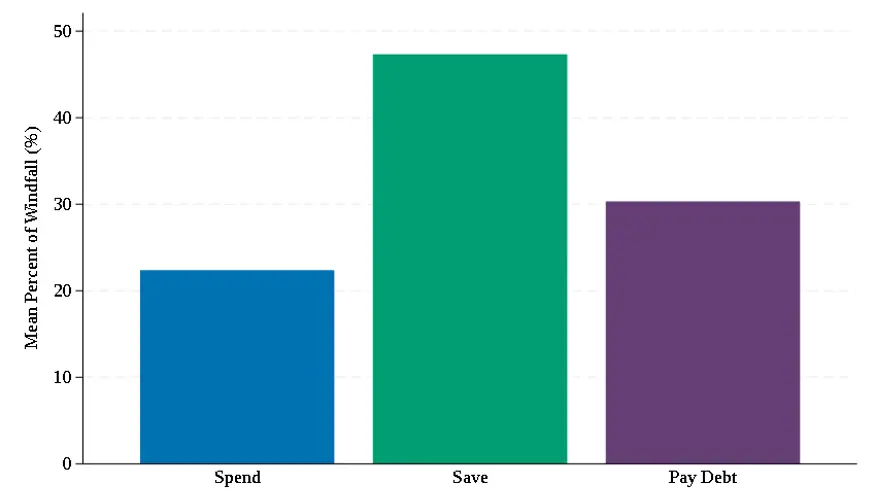
On average, households spend 22 percent of this hypothetical windfall, save 47 percent, and use 30 percent to pay down debt. The estimated spending response of 22 percent falls well within, though toward the lower end of, the broad range of MPC estimates in the empirical literature. MPCs decline gradually over much of both the income and wealth distributions (moving from around 25 percent to 20 percent) before ticking down sharply at the top of both distributions.2 As a result, relative to other households, households in the top 1 percent of the income and wealth distributions have substantially lower MPCs—about 14 percent and 15 percent, respectively.3 In addition, MPCs are higher for households with less liquidity, for households with greater income uncertainty, and for less-financially knowledgeable households, in line with theoretical predictions from standard models.
Windfall question in the 2025 SCF
The SCF is a triennial cross-sectional survey that has been conducted in its current form since 1989, capturing detailed information on household income, wealth, demographics, and many other household financial characteristics and attitudes. Notably, it oversamples wealthy households to capture the full distribution of income and wealth.4
We, along with other staff working on the 2025 SCF, introduced a new hypothetical windfall question that allows us to measure a household's MPC.5 Specifically, a respondent is asked:
Imagine you unexpectedly receive a sum of money equal to one month of your family's normal annual income. Thinking over the next 12 months, please indicate the percent of this money that you would save, the percent that you would spend, and the percent that you would use to pay down debts.6
Four features of this question are relevant for interpretation, particularly when placing our estimate within the empirical literature.
First, the question elicits responses to a hypothetical windfall rather than an observed transfer, though there is evidence that hypothetical responses align fairly well with real-world behavior.7
Second, the windfall is defined relative to normal annual income.8 Holding constant the share of a household's cash flow that's at stake, rather than fixing the dollar amount, ensures that the relative size of the shock is uniform across respondents.9 Scaling by normal income, as opposed to income in a given calendar year, removes transitory income fluctuations from this baseline. The windfall question appears shortly after respondents are asked to characterize normal annual income, so this concept is both meaningful to and fresh in the minds of respondents. Based on households' normal income, the median implied windfall is $7,000, and the mean implied windfall is $11,800.
Third, debt repayment is offered as an explicit third choice for allocating the windfall alongside spending and saving. Although economists classify debt reduction as saving, households may consider it an outlay and lump it together with spending. Delineating it explicitly reduces ambiguity, preventing MPCs from being artificially inflated.
Fourth, the question asks about allocations over a twelve-month horizon to allow households a broad time frame to respond to the shock and to align with reference periods elsewhere in the survey. Spending responses likely build over time, such that our MPCs would expectedly be larger than those measured over shorter horizons.
Overall spending responses
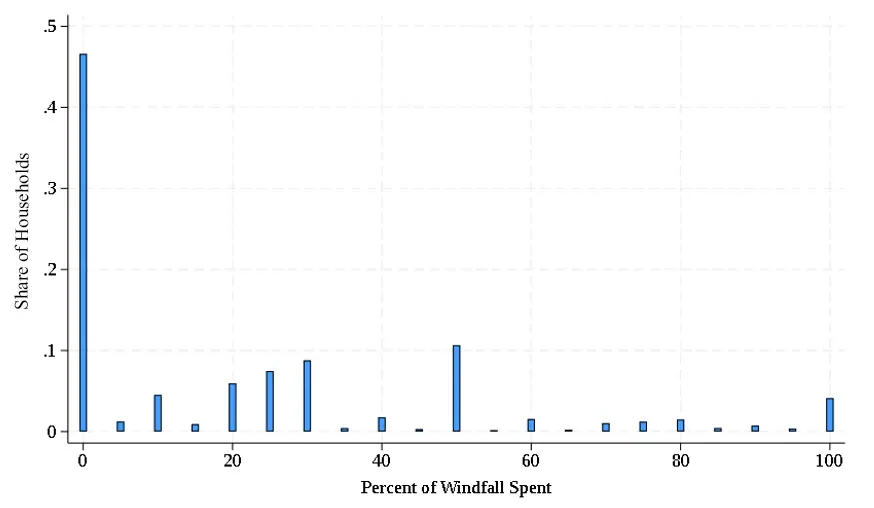
On average, households in the 2025 SCF would spend 22 percent of a one-month windfall of income within the next year, save 47 percent into assets, and use 30 percent to pay down debt (Figure 1). Underneath these averages, responses are quite varied but bunch heavily at round numbers (Figure 2). Roughly 47 percent of households would not spend any of the windfall, and most of the remaining households would spend between 20 and 35 percent of it.10
Figure 1. Mean reported allocation of a one-month income windfallFigure 2. Distribution of the share of a one-month income windfall allocated to spendingNotably, only a small share of households—around 4 percent—would spend all of the windfall, which could partly reflect its large size (one month of a household's normal income). Even the group with the smallest implied windfalls—households in the bottom decile of earners—are basing their responses on $1,500, on average; for context, the maximum Coronavirus Aid, Relief, and Economic Security (CARES) Act stimulus payment was $1,200 for single filers and $2,400 for joint filers.11
Due to the importance of the question, many empirical studies are devoted to recovering MPCs, producing a wide range of estimates generally falling between 0.1 and 0.5. Much of the literature recovers MPCs indirectly, either through natural experiments—such as tax rebates, stimulus payments, lottery winnings, or randomized cash transfers—or randomized controlled trials (e.g., Johnson, Parker, and Souleles, 2006; Fagereng, Holm, and Natvik, 2021; Bartik, Rhodes, Broockman, Krause, Miller, and Vivalt, 2024).12 In all of these approaches, the resulting estimates are setting-specific and may not generalize to the behavior of households in other settings or those unexposed to the shock being studied. Another approach, which has gained traction in recent years and which we leverage here, elicits MPCs within surveys using hypothetical scenarios (e.g., Japelli and Pistaferri, 2014; Christelis, Georgarakos, Japelli, Pistaferri, and van Rooij, 2019; Coibion, Gorodnichenko, and Weber, 2020; Drechsler, Fessler, and Lindner, 2020; Koşar and Melcangi, 2025). To the extent hypothetical responses mirror real-world choices (which existing evidence supports, as noted above), these estimates are generated over wider populations, though they might still be sensitive to sample composition and question framing, particularly with respect to the features noted above. The estimates from hypothetical scenarios also vary quite a bit, with several clustering near 0.35-0.4 and others falling on the lower end near 0.15-0.2. Broadly, our estimated MPC of 0.22 falls toward the lower end of the literature, but it is notably close to consensus estimates from the 2001 and 2008 stimulus payments as well as the directly elicited average MPC over U.S. households in Koşar and Melcangi (2025).13
MPC heterogeneity across households
A major advantage of eliciting MPCs within the SCF is that it allows us to study variation across households of different types, which is relevant for policy design as well as testing theoretical models. This section previews MPC heterogeneity across key dimensions emphasized by the literature—income, wealth, liquidity, income uncertainty, and financial knowledgeability—presenting simple comparisons along each dimension. These initial cuts do not isolate specific dimensions from other relevant factors and should not be interpreted as such.
Income and wealth
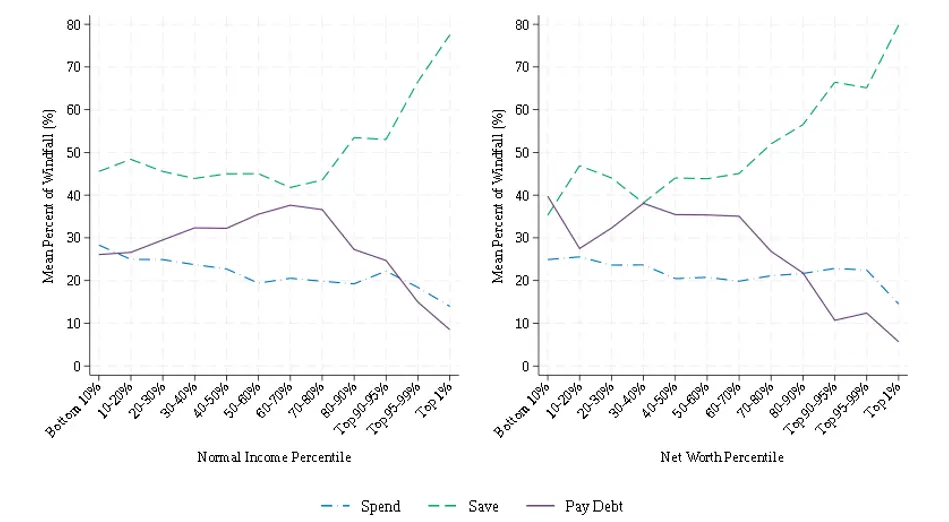
The left panel of Figure 3 shows how responses vary over the normal income distribution, which, relative to sorting by a single year of income, ranks households according to a more stable income position. In general, the share of the windfall that households spend is lower than the share they save and declines gradually with income for much of the distribution, dropping off more notably at the top.14 MPCs peak at 28 percent in the bottom decile and reach their lowest point of 14 percent in the top 1 percent. The saved share of the windfall is the largest of the three options across all income groups, but this share is relatively flat over the bottom two-thirds of the distribution—hovering between 41 and 48 percent of the windfall—and then rises dramatically from there, reaching 67 percent in the 95–99th percentile and 78 percent for the top percent. The share applied to deleveraging essentially coincides with the distribution of household debt in the SCF, rising gradually over the bottom two-thirds of the distribution but declining sharply from there, falling below 10 percent for the top percent of earners.
Allocations across the wealth distribution are similar in magnitude to income, though sorting by wealth concentrates net debtors at the bottom and net savers at the top more aggressively than sorting by income (right panel). MPCs are little changed over the bottom two deciles of wealth (rather than edging down) and drop more sharply at the very top of the distribution. Across the remainder of the distribution, the decline in MPCs is relatively similar for wealth and income.
Altogether, the SCF reveals that average MPCs decline gradually with both income and wealth—from around 25 percent to 20 percent—before dropping off in the upper segments. Average MPCs among households in the top percent of the income and wealth distributions are about 14 percent and 15 percent, respectively. While notably lower than the rest of the distribution, removing these households (a group uniquely captured by the SCF) leaves the aggregate average MPC virtually unchanged; thus, their inclusion does not affect the placement of our estimate with respect to other estimates in the literature. Shifting focus to the bottom of the distribution, the share of the windfall applied to deleveraging is perhaps surprisingly high in light of their presumably high immediate spending needs, which is consistent with these households facing competing demands for limited resources. Reflecting these distributional patterns, the remaining comparisons in this note are based on regression-adjusted MPC estimates that hold (log) normal income constant.
Liquidity
Many leading theories in the literature posit liquidity as a key determinant of MPCs. Standard saving models assume that households draw on liquid assets to buffer against shocks, making their spending relatively insensitive to transitory income changes. Conversely, spending among households with limited liquid holdings ("hand-to-mouth households") is highly sensitive to such changes. Because of its comprehensive balance sheet detail, the SCF is uniquely well-positioned to examine whether MPCs behave according to these models.
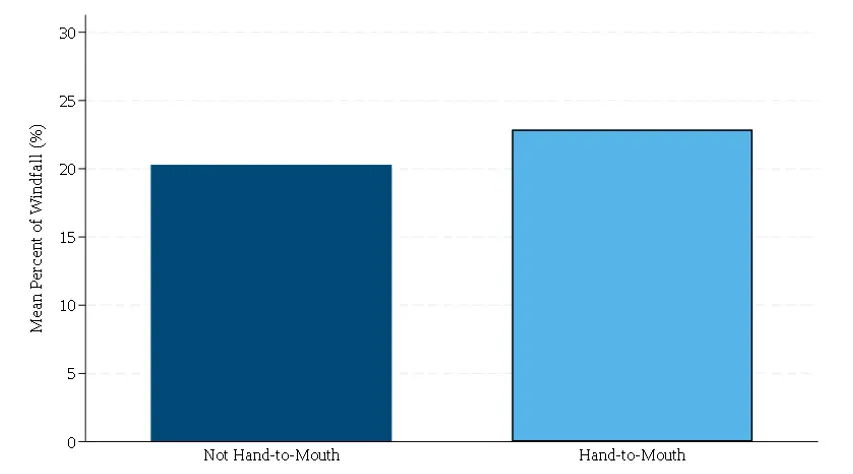
Following the literature, we characterize a household's liquidity according to the number of months of normal income held in liquid assets, classifying households as "hand-to-mouth" if they hold less than one-half month of normal income in such assets (e.g., Kaplan and Violante, 2014).15 Hand-to-mouth households spend 22.9 percent of their windfall, compared with 20.3 percent among households with more liquidity (Figure 4), which is directionally consistent with theoretical predictions but somewhat smaller than one might expect.16
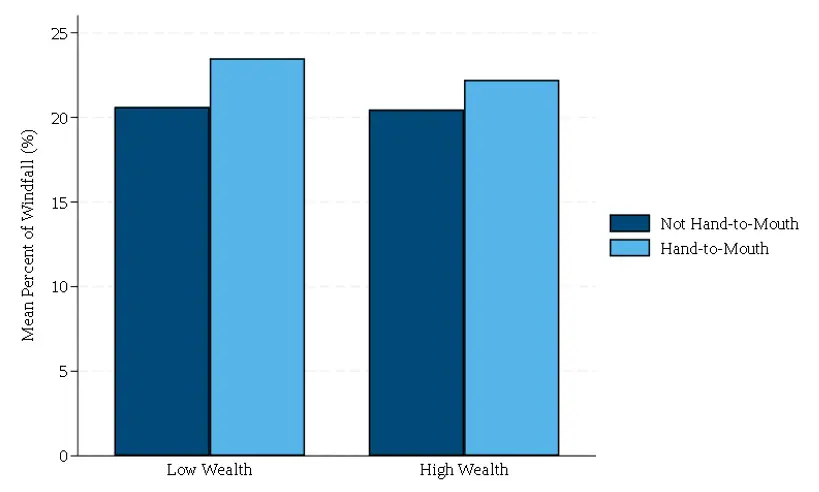
Figure 4. Conditional MPC by hand-to-mouth statusA household's total wealth is likely particularly material to how sensitive their spending is to their liquid wealth position. Thus, we estimate slightly more elaborate regression-adjusted MPCs by hand-to-mouth status, allowing the relationship between hand-to-mouth status and MPCs to vary according to whether the household is low or higher wealth.17 Households whose wealth is below the 30th percentile of the wealth distribution are considered low wealth.
Figure 5 displays the resulting differences by hand-to-mouth status (within panels) and wealth group (across panels). Comparing the side-by-side bars in each panel, differences between hand-to-mouth and non-hand-to-mouth households remain substantial. Across panels, hand-to-mouth status generates larger MPC differentials among lower-wealth households, but notably, differences persist among higher-wealth households who hold most of their assets in illiquid forms. Specifically, among low-wealth households, hand-to-mouth status increases the spending response by 2.9 percentage points relative to non-hand-to-mouth households, compared with a 1.8 percentage point increase among higher-wealth households. These results are consistent with liquidity constraints among "wealthy hand-to-mouth" households binding at higher wealth levels than they do for poor hand-to-mouth households. While our broader results suggest liquidity is a relevant factor in aggregate macroeconomic dynamics (Kaplan, Violante, and Weidner, 2014), the MPC among hand-to-mouth households is smaller than what models generally imply. Nonetheless, our results are quite in line with some estimates from the empirical literature using actual shocks. For example, recent work by Boehm, Fize, and Jaravel (2025) runs a randomized controlled trial and finds average MPCs of 0.23, very close to our baseline estimates. Their study, like ours, recovers higher MPCs among liquidity constrained households with differences smaller than is implied by theoretical models.
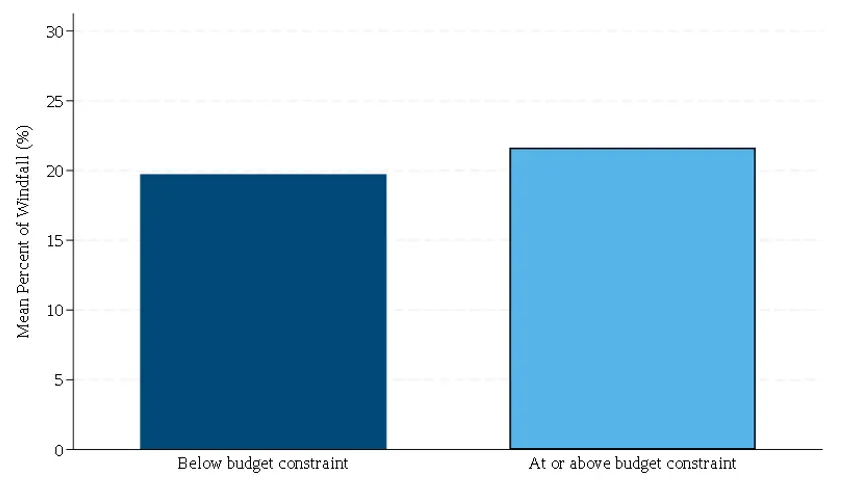
Figure 5. Conditional MPC by hand-to-mouth status and wealth groupBeyond asset holdings, we can also examine variation over households differing in liquidity using a qualitative question regarding budget shortfalls over the past year, which provides a more dynamic view of whether households are operating at their budget constraint. Specifically, households are asked whether their spending exceeded, matched, or fell below their income. Households operating at (or beyond) their budget constraint over the past year would spend 21.6 percent of a windfall, compared with 19.7 percent among those operating within their budget constraint (Figure 6).
Figure 6. Conditional MPC by whether a household spent within its budget constraint last yearIncome uncertainty and financial literacy
Beyond economic capacity and liquidity, MPCs might reflect both a household's perceived budgetary risk and its capacity to optimize over complex choices.
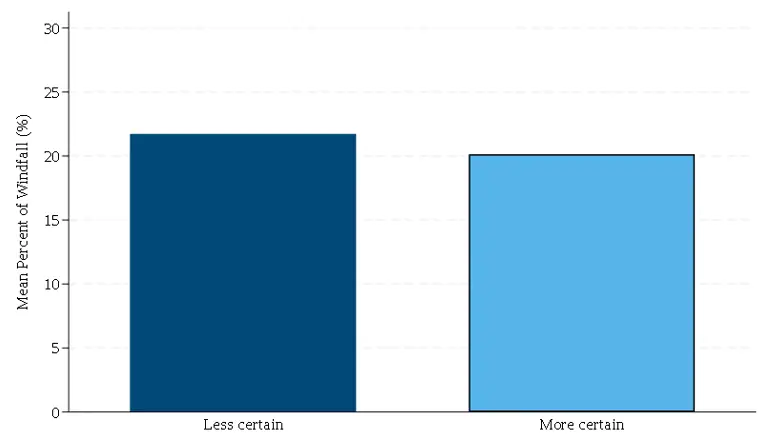
Figure 7 evaluates differences by perceived budgetary risk through the lens of precautionary motives based on whether households have a good idea of what their income will be in the coming year. While households facing greater income uncertainty generally favor saving to defend against future volatility, the arrival of a windfall alters this dynamic. Buffer stock models predict that at a given level of wealth, a "certain" windfall alleviates some of that risk, providing households that have greater income uncertainty a sharper relief in financial anxiety that translates into a higher MPC (Carroll and Kimball, 1996). Consistent with this prediction, holding normal income constant, households who are more uncertain of their income would spend a larger share of their windfall than those who are more certain (21.7 percent versus 20.1 percent, respectively). Indeed, our results directionally align with Koşar and Melcangi (2025), who find that MPCs are increasing and concave in subjective earnings growth uncertainty within the Survey of Consumer Expectations (SCE), which holds within quartiles of net liquid wealth. The estimated difference is smaller in our setting, potentially due to the coarseness of our measure.
Figure 7. Conditional MPC by income uncertaintyFigure 8 evaluates differences in households' underlying capacity to optimize based on their financial knowledgeability (e.g., Lusardi, Michaud, and Mitchell, 2017). In a basic intertemporal framework, financially knowledgeable households can better optimize over time and would generally save more of their windfall. (Still, a higher MPC among less financially knowledgeable households does not necessarily imply suboptimal behavior.) Respondents that answer all three financial literacy questions in the SCF correctly—constituting roughly half of households—are classified as "more financially knowledgeable." The MPC among such households is lower than less knowledgeable ones—19.9 percent versus 21.4 percent, respectively—consistent with this framework.18
Figure 8. Conditional MPC by financial knowledgeabilityConclusion
The new SCF question provides a novel insight into MPCs across the distribution of households in the United States. The survey captures MPCs across the full breadth of income and wealth in the country and also provides detailed information about households that allow us to understand how MPCs may vary across household characteristics.
Measuring MPCs inside the SCF has broader value, as many quantitative macroeconomic models are calibrated to income and wealth distributions taken from the survey. Having an internal measure of MPCs (or of spending levels, see the companion note: Aladangady, Bricker, Chang, Goodman, and Li, 2026b) allows researchers to discipline the joint distribution of spending responses and balance sheets within a single dataset rather than combining moments across surveys with different sampling frames and different wealth concepts.
Finally, the survey—which has been continuously run in its current form since 1989—will provide a means to track changes in household spending behavior in the future. Insights into the distribution of MPCs will provide a dynamic view of how households manage shocks over time and across different points in the business cycle.
References
Aladangady, Aditya, Jesse Bricker, Andrew C. Chang, Sarena Goodman, and Gina Li. 2026a. "Informal Support Networks in the Survey of Consumer Finances," FEDS Notes. Washington: Board of Governors of the Federal Reserve System, October 9.
Aladangady, Aditya, Jesse Bricker, Andrew C. Chang, Sarena Goodman, and Gina Li. 2026b. "Measuring Spending in the Survey of Consumer Finances," FEDS Notes. Washington: Board of Governors of the Federal Reserve System, October 9.
Aladangady, Aditya, Jesse Bricker, Andrew C. Chang, Sarena Goodman, Gina Li, Kevin B. Moore, Sarah Reber, Alice Henriques Volz, and Richard A. Windle. 2026. Changes in U.S. Family Finances from 2022 to 2025: Evidence from the Survey of Consumer Finances. Washington: Board of Governors of the Federal Reserve System, October, https://doi.org/10.17016/8799.1.
Bartik, Alexander W., Elizabeth Rhodes, David E. Broockman, Patrick K. Krause, Sarah Miller, and Eva Vivalt. 2024. "The Impact of Unconditional Cash Transfers on Consumption and Household Balance Sheets: Experimental Evidence from Two US States." NBER Working Paper No. 32784.
Blundell, Richard, Luigi Pistaferri, and Ian Preston. 2008. "Consumption Inequality and Partial Insurance." American Economic Review 98 (5): 1887–1921.
Board of Governors of the Federal Reserve System. Division of Research and Statistics, Microeconomic Surveys (2026). "Survey of Consumer Finances."
Boehm, Johannes, Etienne Fize, and Xavier Jaravel. 2025. "Five Facts about MPCs: Evidence from a Randomized Experiment." American Economic Review 115 (1): 1–42.
Christelis, Dimitris, Dimitris Georgarakos, Tullio Jappelli, Luigi Pistaferri, and Maarten van Rooij. 2019. "Asymmetric Consumption Effects of Transitory Income Shocks." Economic Journal 129 (622): 2322–2341.
Carroll, Christopher D., and Miles S. Kimball. 1996. "On the Concavity of the Consumption Function." Econometrica 64 (4): 981–992.
Coibion, Olivier, Yuriy Gorodnichenko, and Michael Weber. 2020. "How Did U.S. Consumers Use Their Stimulus Payments?" NBER Working Paper No. 27693.
Colarieti, Roberto, Pierfrancesco Mei, and Stefanie Stantcheva. 2024. "The How and Why of Household Reactions to Income Shocks." NBER Working Paper No. 32191.
Drescher, Katharina, Pirmin Fessler, and Peter Lindner. 2020. "Helicopter Money in Europe: New Evidence on the Marginal Propensity to Consume across European Households." Economics Letters 195.
Fagereng, Andreas, Martin B. Holm, and Gisle J. Natvik. 2021. "MPC Heterogeneity and Household Balance Sheets." American Economic Journal: Macroeconomics 13 (4): 1–54.
Fuster, Andreas, Greg Kaplan, and Basit Zafar. 2021. "What Would You Do with $500? Spending Responses to Gains, Losses, News, and Loans." Review of Economic Studies 88 (4): 1760–1795.
Graziani, Grant, Wilbert van der Klaauw, and Basit Zafar. 2016. "Workers' Spending Response to the 2011 Payroll Tax Cuts." American Economic Journal: Economic Policy 8 (4): 124–159.
Jappelli, Tullio, and Luigi Pistaferri. 2014. "Fiscal Policy and MPC Heterogeneity." American Economic Journal: Macroeconomics 6 (4): 107–136.
Jappelli, Tullio, and Luigi Pistaferri. 2020. "Reported MPC and Unobserved Heterogeneity." American Economic Journal: Economic Policy 12 (4): 275–297.
Johnson, David S., Jonathan A. Parker, and Nicholas S. Souleles. 2006. "Household Expenditure and the Income Tax Rebates of 2001." American Economic Review 96 (5): 1589–1610.
Kaplan, Greg, Giovanni L. Violante, and Justin Weidner. 2014. "The Wealthy Hand-to-Mouth." Brookings Papers on Economic Activity, 77–138.
Kaplan, Greg, and Giovanni L. Violante. 2014. "A Model of the Consumption Response to Fiscal Stimulus Payments." Econometrica 82 (4): 1199–1239.
Koşar, Gizem, and Davide Melcangi. 2025. "Subjective Uncertainty and the Marginal Propensity to Consume." Federal Reserve Bank of New York Staff Reports No. 1148.
Kueng, Lorenz. 2018. "Excess Sensitivity of High-Income Consumers." Quarterly Journal of Economics 133 (4): 1693–1751.
Lusardi, Annamaria, Pierre-Carl Michaud, and Olivia S. Mitchell. 2017. "Optimal Financial Knowledge and Wealth Inequality." Journal of Political Economy 125 (2): 431–477.
Orchard, Jacob, Valerie A. Ramey, and Johannes F. Wieland. 2025. "Micro MPCs and Macro Counterfactuals: The Case of the 2008 Rebates." Quarterly Journal of Economics 140 (3): 2001–2052.
Parker, Jonathan A., and Nicholas S. Souleles. 2019. "Reported Effects versus Revealed-Preference Estimates: Evidence from the Propensity to Spend Tax Rebates." American Economic Review: Insights 1 (3): 273–290.
Patterson, Christina. 2023. "The Matching Multiplier and the Amplification of Recessions." American Economic Review 113 (4): 982–1012.
Puig, Aina. 2026. "Racial Differences in Consumption and Saving Behavior: New Survey Evidence and Quantitative Theory of Status Signaling." Working Paper.
Sahm, Claudia R., Matthew D. Shapiro, and Joel Slemrod. 2012. "Check in the Mail or More in the Paycheck: Does the Effectiveness of Fiscal Stimulus Depend on How It Is Delivered?" American Economic Journal: Economic Policy 4 (3): 216–250.
Shapiro, Matthew D., and Joel Slemrod. 2003. "Consumer Response to Tax Rebates." American Economic Review 93 (1): 381–396.
Appendix
Figure A1. Selected average MPC estimates from the literature1. Division of Research and Statistics, Board of Governors of the Federal Reserve System. The analysis and conclusions set forth are those of the authors and do not reflect the views of the Board of Governors or the Federal Reserve staff. Aladangady: [email protected], ORCID 0009-0003-8366-3511. Bricker: [email protected], ORCID 0000-0002-0404-2561. Chang: [email protected], ORCID 0000-0002-9769-789X. Goodman: [email protected]. Li: [email protected], ORCID 0000-0001-9492-0841. We thank Kevin B. Moore, Karen M. Pence, and Alice Henriques Volz for helpful comments. The SCF data used in this note are derived from the final internal version of the survey information. Return to text
2. That said, the MPC at the bottom of the income distribution is notably higher than at the bottom of the wealth distribution—28 percent versus 25 percent—suggesting that how households are organized can be material to observed distributional differences. Return to text
3. The conventional 95 percent confidence intervals for these estimates are (12.9,15.0) and (13.5,15.6), respectively. Return to text
4. See Aladangady, Bricker, Chang, Goodman, Li, Moore, Reber, Volz, and Windle (2026) for a description of the SCF. Our analysis uses their definition of income, and their "net worth" definition of wealth. Return to text
5. The 2025 SCF also introduced new questions on household spending over the previous year and their informal support networks. See Aladangady, Bricker, Chang, Goodman, and Li (2026a, 2026b). Return to text
6. Field interviewers are instructed to fill in numerical responses for each share, ensuring the three shares sum to 99 (to allow equal splits) or 100. The survey instrument also ensured only valid entries were provided. Approximately 2.5 percent of respondents did not respond to one or more parts of this question. Missing values were imputed with standard multiple imputation methods used throughout the survey. Return to text
7. Shapiro and Slemrod (2003) and Parker and Souleles (2019) both find that reported spending responses to the 2001 and 2008 tax rebates line up with what households actually did, as does more recent work by Colarieti, Mei, and Stantcheva (2024), which shows that hypothetical responses mimic historic responses to shocks when the contexts align. Return to text
8. The SCF measures normal income—sometimes referred to as "usual income"—separately from current income by asking households if their current income is "higher," "lower," or the "same" as usual. If the respondent selects "higher" or "lower," they are asked what normal income is and why it differs from current income. If the respondent selects "same," normal income is defined to be current income. Return to text
9. Jappelli and Pistaferri (2014, 2020) field a one-month-of-income question in the Italian Survey of Household Income and Wealth; Fuster, Kaplan, and Zafar (2021) use a fixed $500 windfall. Neither convention dominates. Under a fixed-dollar design, the economic significance of the windfall falls as income rises, while under ours the dollar amount rises with income, so any dependence of the response on the absolute size of a windfall loads onto our income gradient. Fuster, Kaplan, and Zafar find that the share of respondents reporting a positive MPC rises with windfall size, so the distinction is not innocuous either way. Return to text
10. The pattern of responses, with a large spike at zero and heaping at round values, is familiar from other survey-based MPC work. Jappelli and Pistaferri (2014) report 22 percent of SHIW respondents at zero and 24 percent at one half; Puig (2026) also reports 22 percent at zero; Fuster, Kaplan, and Zafar (2021) find a much larger 70 percent of respondents report at (or below) zero in response to a $500 windfall; Koşar and Melcangi (2025) find 48 percent at zero in the Survey of Consumer Expectations (SCE). Return to text
11. Altering the framing to the share of the windfall that is not saved in assets (i.e., the share allocated to spending or paying down debt), 19.6 percent of households would not save any of it. Return to text
12. A smaller set of studies recovers MPCs through structural decomposition methods (e.g., Blundell, Pistaferri, and Preston 2008; Patterson 2023). Return to text
13. Figure A1 in the appendix shows MPC estimates from a group of selected studies, breaking out estimates for studies that use a hypothetical windfall versus not and showing over what time horizon the studies estimate their MPCs over. The MPC estimate of 0.22 in the 2025 SCF is consistent with retrospective surveys of stimulus, such as Sahm, Shapiro, and Slemrod (2012) and Shapiro and Slemrod (2003), who find 21.8 percent of households would "mostly spend" their stimulus. Difference-in-differences estimates from Johnson, Parker and, Souleles (2006) range from 0.2 to a high upper-bound of 0.4, but more modern difference-in-differences estimates in Orchard, Ramey, and Wieland (2025), which they combine with macro counterfactuals, place estimates on the lower end of this range. Among survey-based estimates, ours is closest to Koşar and Melcangi (2025) who use a similar question in the Survey of Consumer Expectations, but somewhat lower than 1-year horizon estimates by Colarieti, Mei, and Stantcheva (2024) or European studies (Japelli and Pistaferri, 2014 and 2020; Drechsler, Fessler, Lindner, 2020). Return to text
14. This gradient over income is consistent with most of the literature. Jappelli and Pistaferri (2014, 2020), Johnson, Parker, and Souleles (2006), Coibion, Gorodnichenko, and Weber (2020), and Christelis, Georgarakos, Jappelli, Pistaferri, and van Rooij (2019) all find larger responses lower down the distribution, although Shapiro and Slemrod (2003), Sahm, Shapiro, and Slemrod (2012), and Fuster, Kaplan, and Zafar (2021) do not. Several of those studies use fixed-dollar windfalls whose economic significance falls as income rises, which may flatten the measured gradient. A notable exception is Kueng (2018), who finds MPCs remain high for higher income households, which is attributed to higher income households having lower welfare losses from small "mistakes" from optimal spending. Return to text
15. Liquid assets are defined as the sum of transaction accounts (checking, savings, and money market accounts), call accounts, certificates of deposit, prepaid cards, and directly held mutual funds, stocks, and bonds held outside retirement accounts. Return to text
16. Several alternative definitions all estimate an MPC differential in the range of four to six percentage points. Return to text
17. Specifically, we regress MPC on hand-to-mouth status, low wealth status, log normal income, log wealth, and the interaction of hand-to-mouth status with low-wealth status. Return to text
18. In contrast, Jappelli and Pistaferri (2014) find their financial literacy indicator unrelated to the MPC. Return to text
Please cite this note as:Aladangady, Aditya, Jesse Bricker, Andrew C. Chang, Sarena Goodman, and Gina Li (2026). "Heterogeneity in the Marginal Propensity to Consume among U.S. Households," FEDS Notes. Washington: Board of Governors of the Federal Reserve System, October 09, 2026, https://doi.org/10.17016/2380-7172.4197.
Disclaimer: FEDS Notes are articles in which Board staff offer their own views and present analysis on a range of topics in economics and finance. These articles are shorter and less technically oriented than FEDS Working Papers and IFDP papers.
Back to TopLast Update: October 09, 2026