Introduction: Annual UK house price growth halves in September
Good morning, and welcome to our rolling coverage of business, the financial markets and the world economy.
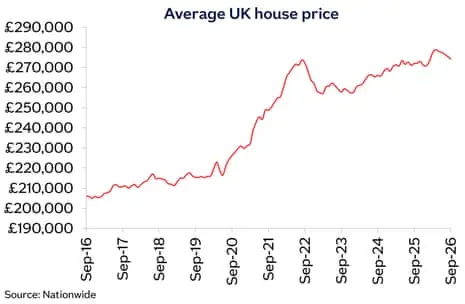
The rate of annual house price growth across the UK has halved, according to lender Nationwide this morning, as rising mortgage rates cool the market.
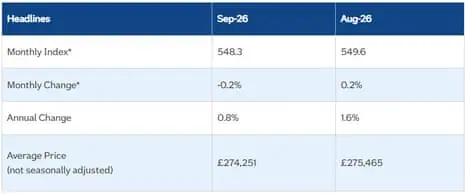
Nationwide’s latest gauge of house prices shows that prices fell by 0.2% in September, dragging annual house price growth down to 0.8%, the weakest rate of growth since December 2025. That’s down from 1.6% in August.
This is weaker than the City expected: Economists polled by Reuters had forecast prices would be flat on the month and rise by 1.3% year-on-year.
The average price of a home across the country slipped to £274,251 last month.
Robert Gardner, Nationwide’s chief economist, attributed the slowdown on recent increases in mortgage rates from lenders:
“Market activity and house prices have remained subdued in recent months, in part reflecting the uncertain economic backdrop. Geopolitical tensions remain high, with the conflict in the Middle East exerting upward pressure on energy prices, fanning inflation concerns.
This in turn has led to mounting financial market expectations of Bank Rate increases, which has maintained upward pressure on the market interest rates which underpin mortgage pricing.
Yesterday, Moneyfacts reported that the average two-year fixed residential mortgage rate is at its highest since July 2024, while the average five-year is at its highest since 10 October 2023 – with both rates above 5.9%.
Nationwide also reports that prices rose by fastest in Northern Ireland (where prices have risen 5.9% year on year), while East Anglia was the weakest performing region, with annual decline of 0.7%.
The agenda
7am BST: Nationwide’s house price index
9am BST: Eurozone manufacturing PMI for September
9.30am BST: UK manufacturing PMI for September
10.30am US Challenger Job Cuts
3pm BST: US manufacturing PMI for September