Introduction
A high token throughput doesn't necessarily translate to a fast user experience in a large language model (LLM) application. The first token may take too long to arrive, or subsequent tokens may stream too slowly, especially under concurrent load. Throughput alone doesn't capture these differences.
LLM inference metrics help break performance down into measurable components, from the initial response delay to token generation speed and overall system load. This article covers nine key metrics, their formulas, and how to use them to evaluate latency, identify bottlenecks, and track performance over time:
- Per-request latency: time to first token (TTFT), end-to-end latency (E2E), token generation time, time per output token (TPOT), and inter-token latency (ITL)
- Latency across many requests: mean, median, and tail percentiles
- Server load: requests per second (RPS) and tokens per second (TPS)
- Service quality: goodput
We start with the timeline of a single request.
Reading a Request Timeline
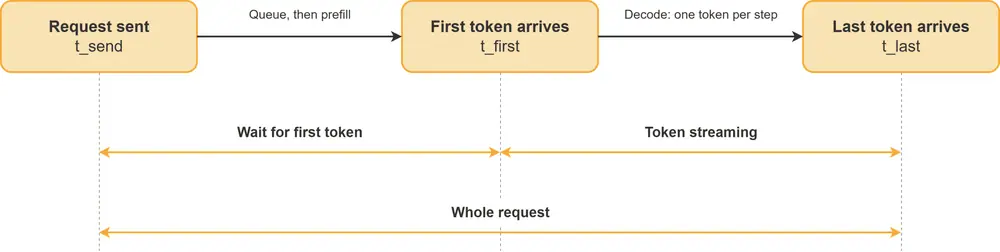
Four values define most of the latency metrics below. The value tsend is the moment the request leaves the client, tfirst is the arrival time of the first output token, tlast is the arrival time of the last output token, and Nout is the number of output tokens. ITL also needs the arrival time tj of each individual output token, where t1 = tfirst and t_Nout = tlast.
Laid on a timeline, the three timestamps cut a request into two segments:
Before tfirst, the request may wait in a queue, and then the server runs prefill, which processes the prompt and produces the first token. After tfirst, the server runs decode and emits tokens one step at a time, usually one token per step. Each latency metric below measures one of these segments or the whole span.
Measuring Latency
The first six metrics describe how long a user waits, for one request and then across many.
1. Time to First Token
TTFT is the delay between sending a request and receiving the first output token. It includes network travel, any wait in the server queue, and the prompt-processing step, so it grows with server load and with prompt length.
\[
TTFT = tfirst - tsend
\]
Interactive chat applications watch this number most closely, because it sets how long the user stares at a blank screen.
2. End-to-End Latency
E2E latency is the total wait, from sending the request to receiving the last token.
\[
E2E = tlast - tsend
\]
It is the sum of the first-token wait and the streaming time that the next metric measures.
3. Token Generation Time
Token generation time is the duration of the streaming segment: how long the server takes to deliver every token after the first.
\[
TokenGen = tlast - tfirst = E2E - TTFT
\]
Token generation time grows with the number of output tokens, so judge the speed of the stream with TPOT (discussed next), which divides that length out.
4. Time per Output Token
TPOT is the average time between output tokens after the first one. It spreads the token generation time evenly over the tokens that follow the first.
\[
TPOT = (E2E - TTFT)/(Nout - 1) = (TokenGen)/(Nout - 1)
\]
The first token belongs to TTFT, which is why the denominator is Nout - 1, and why TPOT is undefined for a reply with a single token. Benchmarking tools disagree on details here: some include TTFT in the average, and some use ITL as another name for TPOT. Confirm the definition before comparing results across tools.
5. Inter-Token Latency
ITL is the gap between two consecutive output tokens. A request with Nout tokens has Nout - 1 gaps, and each gap is its own measurement.
\[
ITLj = tj+1 - tj, j = 1, …, Nout - 1
\]
For one request, the mean of its ITL values equals its TPOT. Across R requests, the two averages weight the data differently. Writing Ni for the output tokens of request i, the mean ITL counts every gap once, and the mean TPOT counts every request once:
\[
overlineITL = (∑i=1R ∑j=1Ni - 1 ITLi,j)/(∑i=1R (Ni - 1))
\qquad
overlineTPOT = (1)/(R) ∑i=1R TPOTi
\]
A few long requests dominate the first average, and the second gives short and long requests equal say. ITL also keeps every individual gap, which is where a stall in the stream shows up.
6. Mean, Median, and Tail Percentiles
Latency varies from request to request, so one number per request becomes a distribution across many requests.
- The mean is the average of all values and follows outliers
- The median, also called P50, is the value that half of the requests fall at or below and reflects the typical user
- P99 is the value that 99% of requests fall at or below and shows the tail, with P90 and P95 as softer versions
Apply all three to TTFT, TPOT, and E2E separately.
With the N measured values sorted in ascending order as x(1) ≤ x(2) ≤ … ≤ x(N), the nearest-rank method gives:
\[
x̄ = (1)/(N) ∑i=1N xi
\qquad
Pk = x(lceil (k)/(100) N rceil)
\]
Compute each percentile from the raw samples of all servers combined, because an average of per-server P99 values is not the P99 of the combined traffic.
Measuring Throughput and Goodput
The last three metrics describe the server as a whole, over a measurement window from tstart to tend.
7. Requests per Second
RPS counts the requests the server completes per second of wall-clock time.
\[
RPS = (Ncompleted)/(tend - tstart)
\]
RPS ignores how much work each request carries, so compare it only across runs with the same mix of prompt and output lengths.
8. Tokens per Second
TPS counts the tokens the server processes per second across all active requests. It has an output form and an input form. Writing Nprompt,i for the prompt tokens of request i:
\[
TPSout = (∑i Nout,i)/(tend - tstart)
\qquad
TPSin = (∑i Nprompt,i)/(tend - tstart)
\]
State which form a quoted number uses, since a workload with long prompts and short replies can post a high input TPS while producing few output tokens.
9. Goodput
Goodput is the rate of successfully completed requests that meet your service-level objectives (SLOs), which is how serving benchmarks such as vLLM compute it. An SLO is a latency limit, such as a ceiling on TTFT or TPOT, and a request counts only when it satisfies every limit. The DistServe paper uses the term for a capacity instead: the maximum request rate a GPU sustains within its latency constraints. Writing sttft, stpot, and se2e for those limits, request i is good when:
\[
TTFTi ≤ sttft land TPOTi ≤ stpot land E2Ei ≤ se2e
\]
Counting the good requests and dividing by the window gives goodput:
\[
Goodput = (Ngood)/(tend - tstart)
\]
Goodput never exceeds RPS, and the gap between them is the rate of requests that missed at least one target.
Wrapping Up
Inference metrics split one request into a first-token wait and a stream, then describe how a server performs across many requests and how many of them meet your targets. The table below summarizes them:
| Metric | Formula | Answers |
|---|---|---|
| TTFT | tfirst - tsend | How long the reply takes to start |
| E2E | tlast - tsend | How long the whole reply takes |
| Token generation time | tlast - tfirst | How long the stream lasts |
| TPOT | (E2E - TTFT)/(Nout - 1) | How fast tokens arrive on average |
| ITL | tj+1 - tj | Whether the stream stalls |
| Mean, median, P99 | x(lceil 0.99 N rceil) for P99 | How typical and slowest requests compare |
| RPS | (Ncompleted)/(tend - tstart) | How many requests complete per second |
| TPS | (∑i Nout,i)/(tend - tstart) | How many tokens the server produces per second |
| Goodput | (Ngood)/(tend - tstart) | How many requests meet every SLO |
References and Further Learning:
- Key Metrics for LLM Inference | Modular Handbook
- Benchmarking Metrics for LLM Inference
- DistServe: Disaggregating Prefill and Decoding for Goodput-Optimized Serving
- LLM Inference Performance Engineering: Best Practices
Happy learning!
Bala Priya is a developer, educator, and technical writer based in India. She writes about programming, data science, machine learning, and AI, with a focus on making complex technical ideas practical and approachable. She creates tutorials, how-to guides, and deep dives that help developers build, solve problems, and understand complex technical concepts. Her technical interests include LLM applications, agentic AI, graph algorithms, computer vision, explainable AI, and ML systems. When she’s not writing or coding, Bala is usually reading classic literature, epic fantasy, or speculative fiction. She also enjoys talking about books, learning new things, and sharing what she learns with the developer community.