International production is increasingly organized through networks of firms that source inputs, assemble products, and supply customers across borders. As these networks deepen, conditions in one country matter more for output and prices in another, so domestic outcomes depend less on domestic conditions alone and more on the economies and sectors on which domestic production relies. This note analyzes whether this interdependence has increased in recent years, looking at two dimensions: first the association of supply-chain pressures at home and abroad with domestic inflation, and second the relationship between intermediate-input trade and business-cycle comovement.
Both dimensions build on a large literature on global inflation and its link to input trade (Ciccarelli and Mojon 2010; Auer et al. 2019; de Soyres and Franco 2019) and on trade and output comovement (Frankel and Rose 1998; di Giovanni and Levchenko 2010; Johnson 2014; de Soyres and Gaillard 2022, 2026). This note updates this evidence and asks whether these relationships have strengthened in recent years.
Conceptually, when a firm's foreign suppliers face disruptions or strong demand, its inputs become costlier or slower to obtain, and it raises prices or cuts output over and beyond the state of domestic slack. Such price pressure should show up in producer prices, which are directly exposed to input costs, and in consumer prices to the extent it is passed on. The same linkages carry demand and supply shocks across borders and can pull output cycles together. Consistent with this, I find that longer supplier delivery times, at home and among a country's foreign suppliers, are associated with higher inflation beyond what domestic slack explains, especially for producer prices. The association with foreign suppliers is much stronger in the most recent period, and the link between intermediate-input trade and GDP comovement is also larger in the latest sample, although imprecisely estimated.
These links matter because they suggest that domestic developments, in both prices and quantities, are increasingly influenced by developments abroad. This makes monitoring international conditions, and not only domestic ones, increasingly important.
1. Supply-Chain Pressures and Inflation
Since the pandemic, a growing literature has asked whether supply-chain pressures help explain inflation. Much of this work uses a single world measure of supply-chain pressure, most prominently the New York Fed's Global Supply Chain Pressure Index (GSCPI), which combines shipping costs with delivery-time and backlog information from manufacturing surveys (Benigno et al. 2022), and generally finds that supply-chain pressures contributed to the rise in inflation after 2020 (di Giovanni et al. 2022; Blanchard and Bernanke 2023; Comín, Johnson, and Jones 2023; Bai et al. 2024). A world index has a limitation. It is the same for every country, so it cannot show which economies are more exposed, and its estimated effect comes from movements over time that are common to all countries and hard to separate from other global shocks. This note uses country-specific measures instead. Each economy's own supplier delivery times capture conditions at home, and a foreign index built from the delivery times of its actual trading partners, weighted by their share in its intermediate-input imports, captures exposure to suppliers abroad. The estimates thus draw on differences across countries and not only over time, and I ask whether the relationship has changed since the pandemic.
A Phillips curve relates inflation to the amount of slack in the economy, usually measured by the output gap, together with lagged inflation, which captures persistence (on its evolution, see De Michelis et al. 2024), and cost shocks such as changes in energy prices. The output gap speaks to demand relative to capacity. It says little about whether firms can obtain the inputs they need: a firm facing long delivery times may raise prices or cut output even when demand has not changed. Delivery times could therefore carry information about inflation that the output gap does not. To see whether they do, I add supplier delivery times (SDT) to a standard Phillips curve.2 SDT comes from the manufacturing Purchasing Managers' Index (PMI), a monthly survey in which purchasing managers report whether their suppliers' delivery times have become longer or shorter than in the previous month. The responses are summarized in a diffusion index, whose distance from 50 reflects the balance of firms reporting longer versus shorter delivery times. Monthly values are averaged within each quarter. For economy i in quarter t,
π i,t=α i+β 1 gapi,t+β 2 SDTi,t+∑k=03 δ k Oilt-k+γ π i,t-1+ε i,t,
where π i,t is year-on-year inflation, gapi,t is the output gap,3 Oilt is year-on-year oil price inflation (entering in the current quarter and three lags), and α i is a country fixed effect. SDT is signed so that higher values indicate longer own delivery times. The equation is estimated separately for consumer prices (CPI) and producer prices (PPI), on a quarterly panel of 15 economies4, with standard errors clustered by country. Delivery times lengthen both when supply is disrupted and when demand is strong, so SDT captures supply-chain pressure without distinguishing between these sources.
I estimate the equation on the full sample and on two sub-periods, before 2020 and since 2023. The years 2020 to 2022 are deliberately left out of the sub-periods. The pandemic was an unusual episode, with very large shocks that hit all countries at once and pushed inflation and activity together, so including it would make it hard to tell lasting changes from pandemic effects. Comparing the periods before and after the pandemic instead asks whether the relationship has changed durably.
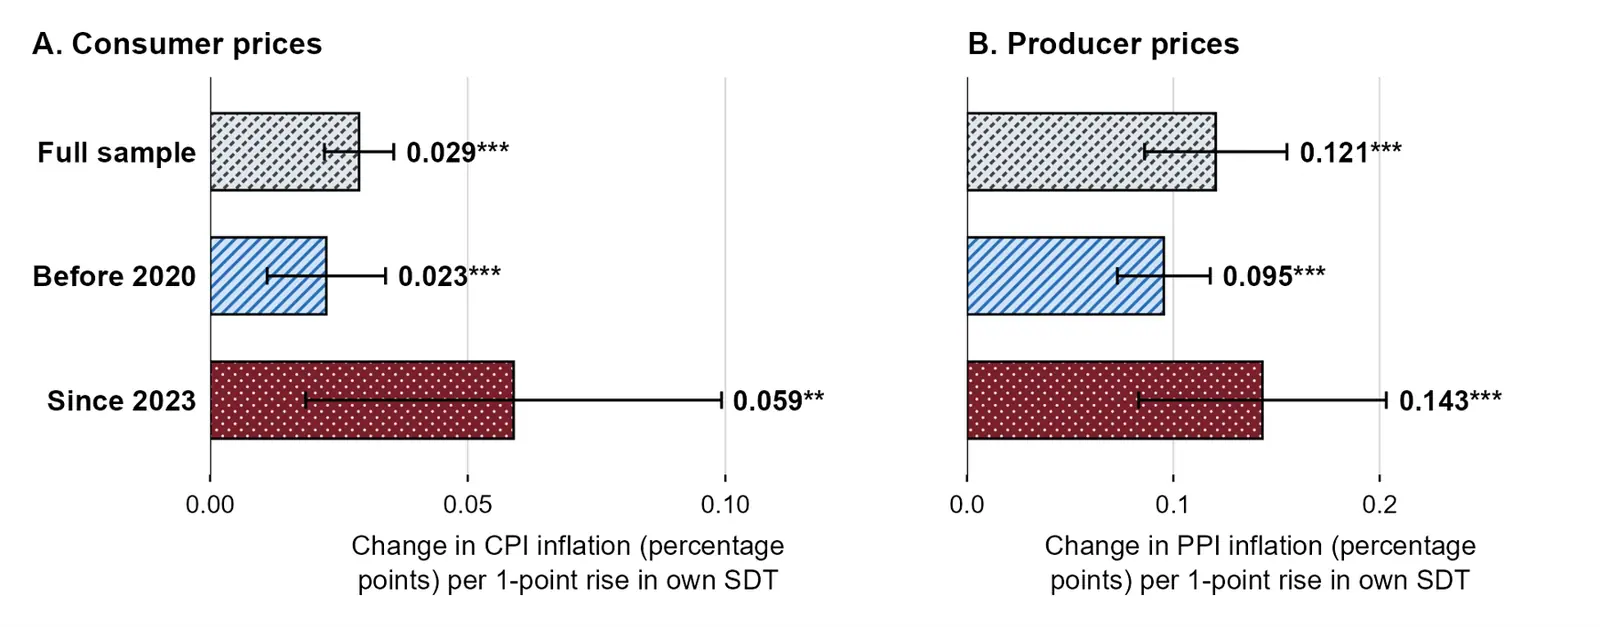
Figure 1 shows a positive and statistically significant coefficient on a country's own delivery times, for both consumer and producer prices, in the full sample and in the periods before 2020 and since 2023. The relationship is much larger for producer prices than for consumer prices. Point estimates are higher since 2023 than before 2020. Delivery times therefore carry information about inflation beyond the output gap, consistent with constraints in input availability, logistics, or production capacity that standard measures of slack miss.
Figure 1. Own Supply-Chain Stress and InflationTo gauge magnitudes, consider a one-standard-deviation change in each variable, measured within countries. A rise of that size in delivery times (about 6.7 index points) is associated with consumer price inflation 0.19 percentage point higher and producer price inflation 0.82 percentage point higher. The same-sized rise in the output gap (about 2.7 percentage points) is associated with inflation 0.11 percentage point higher for consumer prices and 0.13 for producer prices. The delivery time effect is therefore about 1.8 times as large as the output gap effect for consumer prices and about 6.4 times as large for producer prices. Because inflation is persistent, effects accumulate over time: a permanent one-point rise in delivery times is associated with annual inflation that is 0.3 percentage point higher for consumer prices and 0.7 percentage point higher for producer prices once the adjustment is complete.
Domestic prices may also reflect pressures in the economies from which firms source intermediate inputs. For each economy I construct a foreign SDT index,
SDTi,tF=∑j≠ i wij,t SDTj,t,
where wij,t is the share of partner j in economy i's intermediate-input imports.5 For partners without a manufacturing PMI, I use the New York Fed's Global Supply Chain Pressure Index in place of their delivery times. I then replace own SDT with this index in the equation above, so that own and foreign delivery times enter separate regressions.6
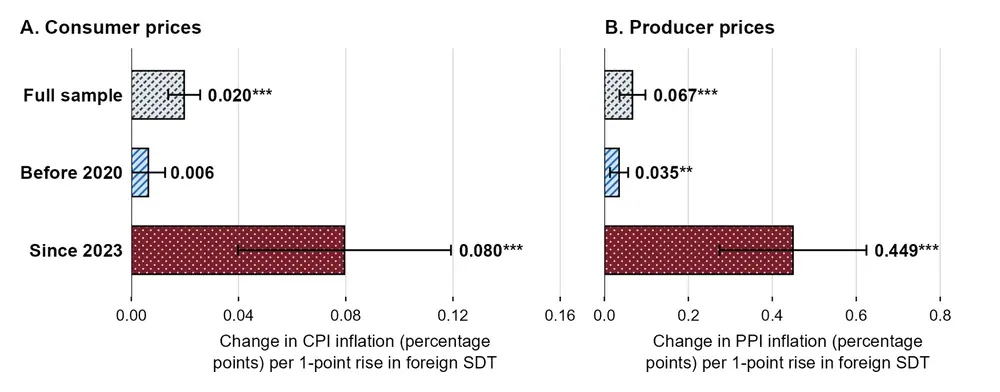
Figure 2 shows a positive relationship between foreign delivery times and both consumer and producer price inflation. The relationship is much stronger since 2023 than before 2020, and the increase is statistically significant at the 1 percent level for both price measures. As with a country's own delivery times, the effect is much larger for producer prices, which is what one would expect if stress at foreign suppliers shows up first in input costs and is only partly passed on to consumer prices. The stronger relationship since 2023 suggests that conditions at a country's suppliers have become more important for its domestic prices, in line with increasing interdependence across economies.
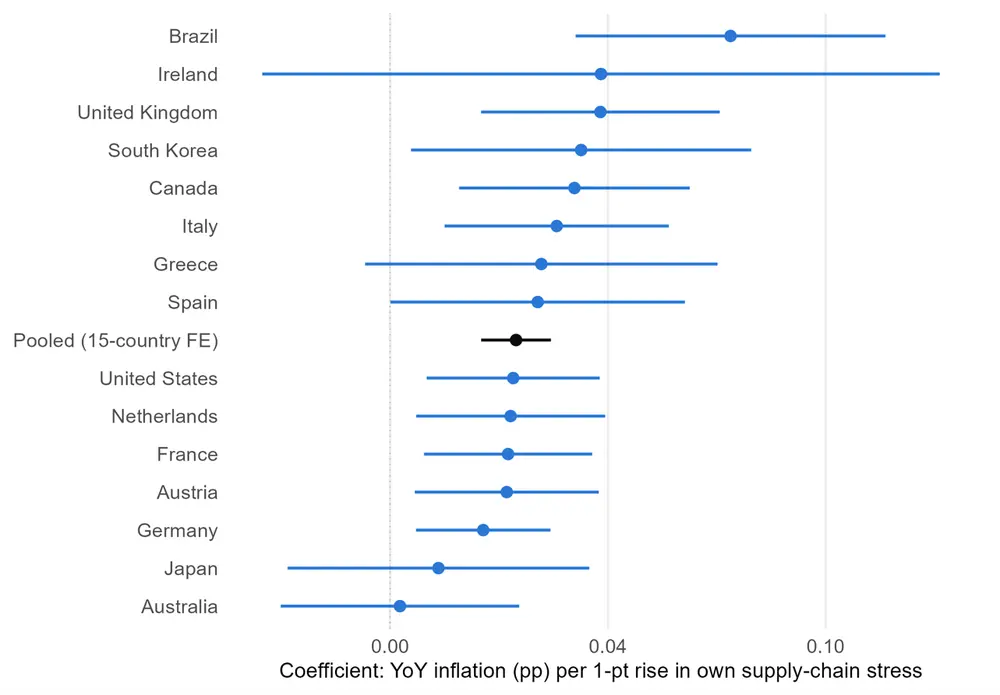
Figure 2. Foreign Supply-Chain Stress and InflationThese results point to a possible cross-border channel for domestic price pressures, although delivery times abroad may reflect supply disruptions, strong demand, or both, and I do not separate them. Appendix Figures 1A to 4A report estimates by economy.
One may ask whether country-specific delivery times add anything to a single global index. Replacing the foreign index with the New York Fed's GSCPI, on the same sample and specification, gives a similar fit and the same message in most cases. That said, a country-specific foreign index fits better price movements for producer prices since 2023. This suggests that country-specific measures built from a country's own suppliers could be a fruitful way forward relative to a single world index, which is the same for every economy.
These results should not necessarily be read as saying that firms have not diversified their sourcing. After repeated shocks, firms may well have diversified suppliers or sourced less from abroad, which would weaken the link between foreign conditions and domestic prices. The regressions do not measure sourcing. What the larger coefficient since 2023 says is that domestic prices moved more closely with conditions at the suppliers that countries used in 2022. This is consistent with greater exposure, but also with a given exposure mattering more when stress is high, or with the foreign index partly reflecting common global conditions. One possible explanation, which I do not test, is that supply disturbances have made up a larger share of recent shocks, and that these may pass through to other economies' prices more than demand shocks do, especially in economies with slack. The period since 2023 is also short, and it will be important to update the analysis once more time has passed, to evaluate its robustness. Section 3 will also turn to how the sources of imports have changed.
2. Production Linkages and Business-Cycle Comovement
A long-standing finding in international economics is that countries with stronger trade ties tend to have more synchronized business cycles (Frankel and Rose 1998; Kose and Yi 2006). Trade in intermediate inputs is especially relevant because it links production processes across borders: changes in demand or production in one economy can affect activity in its trading partners (Burstein et al. 2008; di Giovanni and Levchenko 2010; Johnson 2014; de Soyres and Gaillard 2022, 2026). I revisit this relationship with updated data and ask whether it has changed over time.
For each pair of countries i and j and each ten-year window w, I estimate
corr(GDPi,GDPj)w=α ij+β ln(TIij,w)+δ ln(PIij,w)+ε ij,w,
where the dependent variable is the correlation between the two countries' GDP cycles in window w, TIij,w,w is the pair's trade intensity in intermediate inputs, PIij,w is their bilateral portfolio investment, and α ij is a country-pair fixed effect. In line with the literature, in a given year, trade intensity is the sum of the intermediate inputs that country i sells to country j and that country j sells to country i, divided by the sum of the two countries' GDPs (all in U.S. dollars). Portfolio investment is scaled in the same way, using the sum of the two countries' holdings of each other's portfolio securities (gross asset positions from the IMF Coordinated Portfolio Investment Survey, counted in both directions). For each pair, the logs of these ratios are computed each year and then averaged over the years of window w. Because of the fixed effects, β reflects how the relationship varies within a pair over time, and standard errors are clustered by country-pair.
The pandemic cannot be set aside as cleanly here as in the previous section, because each correlation is computed over ten years. I compare windows ending before 2020 with the two latest windows, ending in 2023 and 2024, and leave out the windows ending in 2020 to 2022. The two latest windows still contain the pandemic years. The Hodrick-Prescott filter used to extract GDP cycles draws on observations on both sides of each year, so the fall in 2020 and the rebound in 2021 would distort the estimated cycle in neighboring years. I therefore replace GDP in 2020 and 2021 with a straight line in logs between 2019 and 2022 before filtering. As a check, Appendix Table 1 drops 2020 to 2022 from every window: the since-2023 estimate is then smaller and no longer statistically significant.
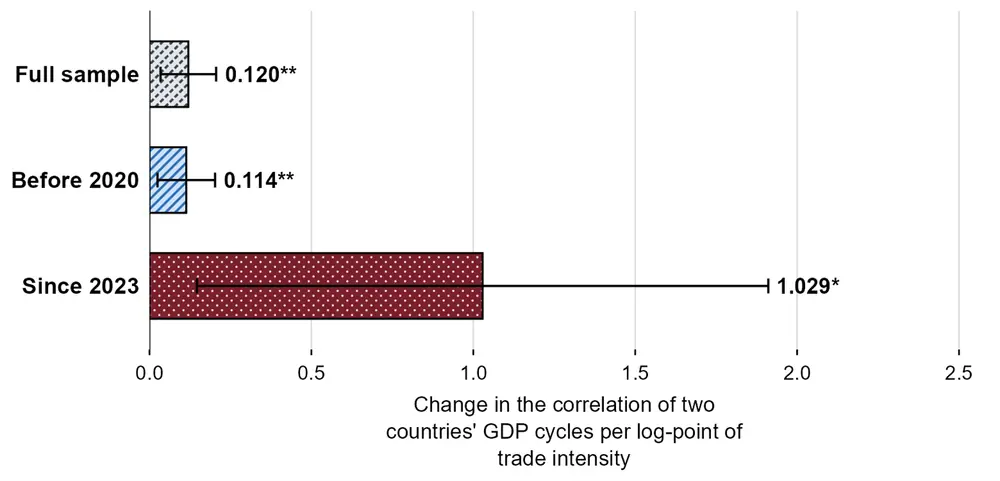
Figure 3 shows a positive relationship in the full sample and over windows ending before 2020. For the two latest windows, ending in 2023 and 2024, the estimate is much larger, but the confidence interval is wide. The relationship is not accounted for by financial integration: the estimates are broadly similar when the portfolio investment control is dropped (Appendix Table 1).
Figure 3. Intermediate-Input Trade Intensity and GDP ComovementOverall, global supply chains look like a useful lens for understanding output fluctuations: when production is shared across borders, a shock to demand or production in one economy reaches the economies that supply it and buy from it, and their cycles tend to move together more where production linkages are denser.
3. Interdependence as Trade Patterns Shift
The geography of international production is changing alongside geopolitical fragmentation. Gopinath et al. (2025) document weaker trade and investment links between geopolitically distant economies since Russia's invasion of Ukraine, and Airaudo et al. (2025a) find that, after the invasion, trade between countries in opposing blocs is 9 to 24 percent lower than trade within blocs, depending on how geopolitical distance is measured. Trade patterns have also shifted unevenly, with China at the center. China's imports from advanced economies have fallen sharply as a share of its GDP, while advanced economies' imports from China have risen in many advanced economies, the U.S. being a notable exception (Airaudo et al. 2025b). Across the fifteen economies in the inflation panel, China's average share of intermediate-input imports rose from 2.2 percent in 2000 to 10.4 percent in 2022, and in 2022 China was the largest single source for Australia, Brazil, Japan, and South Korea.
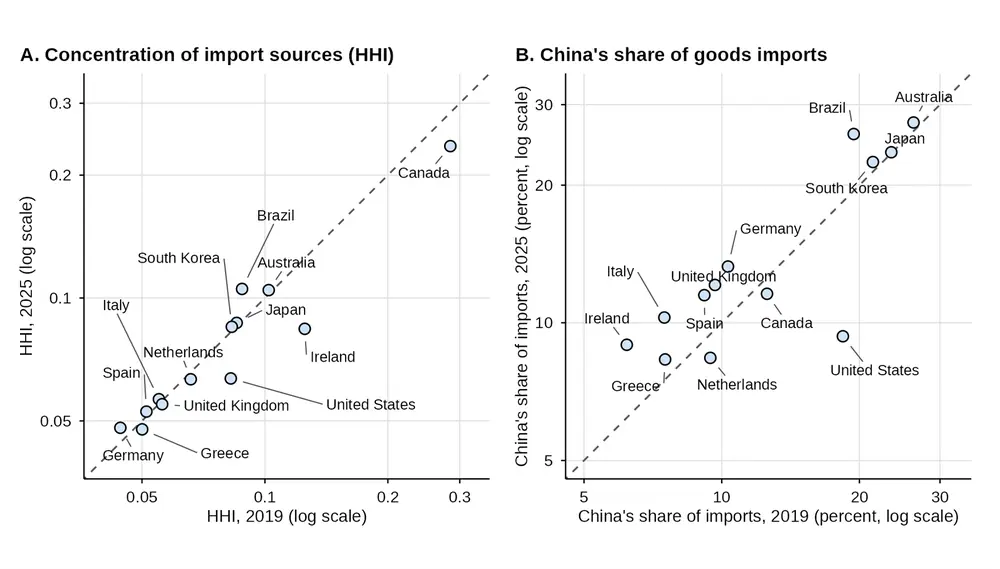
The regressions do not measure how firms source their inputs, so I look directly at where imports come from. For each economy, I compute the Herfindahl-Hirschman index (HHI) of its import sources, the sum of the squared shares of each source country in its imports, so that a higher value means that imports come from fewer countries, together with China's share of its imports. The data are UN Comtrade records of total goods imports, so they cover all goods and not only intermediate inputs, and they run through 2025. Figure 4 compares 2019 with 2025 for the thirteen economies of the inflation panel with 2025 data. Import sourcing has neither broadly concentrated nor broadly diversified: the index changes by less than 0.005 in nine of the thirteen economies, on a scale from 0 to 1, and the median change is close to zero. Imports became noticeably less concentrated in Canada, Ireland, and the United States, and more concentrated in Brazil.
Figure 4. Concentration of Import Sources and China's Share of Imports, 2019 and 2025China's share of imports rose in ten of the thirteen economies, by just over one percentage point at the median and by much more in Brazil. The United States is the main exception: China's share roughly halved and Mexico became its largest source, consistent with the shift in U.S. supply chains after the 2018 to 2019 tariffs on China documented by Aristizabal-Ramirez et al. (2026). Source countries do not necessarily show who produces the goods, however, as that work and Avalos, Hoang, and Van Leemput (2026) find that part of the gains of Mexico and Vietnam in U.S. imports is linked to Chinese firms. These patterns do not support a broad diversification of sourcing since 2019: for most economies the concentration of import sources is little changed, and China accounts for a larger share of imports.
This matters for how interdependence should be read. When many economies rely on the same supplier, a disruption in China reaches all of them at once, and the foreign delivery-time index of these economies partly reflects the same conditions in China. Keeping China's role in mind is useful when thinking about how price pressures and output fluctuations spread across countries.
References
Airaudo, F. S., F. de Soyres, K. Richards, and A. M. Santacreu. 2025a. "Fragmentation? Revisiting the Ideal Point Distance Measure of Geopolitical Distance," FEDS Notes. Washington: Board of Governors of the Federal Reserve System, March 21.
Airaudo, F., F. de Soyres, E. Fisgin, A. Gaillard, A. M. Santacreu, K. Richards, and H. Young. 2025b. "Understanding Trade Fragmentation," FEDS Notes. Washington: Board of Governors of the Federal Reserve System, December 12.
Aristizabal-Ramirez, M., C. A. Avalos, E. Rosenbaum, and E. Van Leemput. 2026. "Mexico in U.S. Supply Chains: Lessons from 2018-19 Tariffs," FEDS Notes. Washington: Board of Governors of the Federal Reserve System, June 5.
Auer, R. A., A. A. Levchenko, and P. Sauré. 2019. "International Inflation Spillovers through Input Linkages," Review of Economics and Statistics, 101(3): 507-521.
Avalos, C. A., T. Hoang, and E. Van Leemput. 2026. "Vietnam's Export Boom to the U.S.: The Role of Chinese Firms," FEDS Notes. Washington: Board of Governors of the Federal Reserve System, July 17.
Bai, X., J. Fernández-Villaverde, Y. Li, and F. Zanetti. 2024. "The Causal Effects of Global Supply Chain Disruptions on Macroeconomic Outcomes: Evidence and Theory," NBER Working Paper 32098. Cambridge, MA: National Bureau of Economic Research, February.
Benigno, G., J. di Giovanni, J. J. J. Groen, and A. I. Noble. 2022. "The GSCPI: A New Barometer of Global Supply Chain Pressures," Staff Report 1017. New York: Federal Reserve Bank of New York, May.
Blanchard, O. J., and B. S. Bernanke. 2023. "What Caused the U.S. Pandemic-Era Inflation?" NBER Working Paper 31417. Cambridge, MA: National Bureau of Economic Research, June.
Burstein, A., C. Kurz, and L. L. Tesar. 2008. "Trade, Production Sharing, and the International Transmission of Business Cycles," Journal of Monetary Economics, 55(4): 775-795.
Ciccarelli, M., and B. Mojon. 2010. "Global Inflation," Review of Economics and Statistics, 92(3): 524-535.
Comín, D., R. C. Johnson, and C. Jones. 2023. "Supply Chain Constraints and Inflation," Finance and Economics Discussion Series 2023-075. Washington: Board of Governors of the Federal Reserve System.
De Michelis, A., G. Lofstrom, M. McHenry, M. Orak, A. Queralto, and M. Scaramucci. 2024. "Has the Inflation Process Become More Persistent? Evidence from the Major Advanced Economies," FEDS Notes. Washington: Board of Governors of the Federal Reserve System, July 19.
de Soyres, F., and S. Franco. 2019. "Inflation Dynamics and Global Value Chains," Policy Research Working Paper 9090. Washington: World Bank, December.
de Soyres, F., and A. Gaillard. 2022. "Global Trade and GDP Comovement," Journal of Economic Dynamics and Control, 138: 104353.
de Soyres, F., and A. Gaillard. 2026. "Trade, Value Added, and Productivity Linkages: A Quantitative Analysis," American Economic Journal: Macroeconomics, 18(1): 149-186.
di Giovanni, J., Ş. Kalemli-Özcan, A. Silva, and M. A. Yildirim. 2022. "Global Supply Chain Pressures, International Trade, and Inflation," NBER Working Paper 30240. Cambridge, MA: National Bureau of Economic Research, July.
di Giovanni, J., and A. A. Levchenko. 2010. "Putting the Parts Together: Trade, Vertical Linkages, and Business Cycle Comovement," American Economic Journal: Macroeconomics, 2(2): 95-124.
Duval, R., N. Li, R. Saraf, and D. Seneviratne. 2016. "Value-Added Trade and Business Cycle Synchronization," Journal of International Economics, 99: 251-262.
Frankel, J. A., and A. K. Rose. 1998. "The Endogeneity of the Optimum Currency Area Criteria," The Economic Journal, 108(449): 1009-1025.
Gopinath, G., P.-O. Gourinchas, A. F. Presbitero, and P. Topalova. 2025. "Changing Global Linkages: A New Cold War?" Journal of International Economics, 153: 104042.
Imbs, J. 2004. "Trade, Finance, Specialization, and Synchronization," The Review of Economics and Statistics, 86(3): 723-734.
Johnson, R. C. 2014. "Trade in Intermediate Inputs and Business Cycle Comovement," American Economic Journal: Macroeconomics, 6(4): 39-83.
Kose, M. A., and K.-M. Yi. 2006. "Can the Standard International Business Cycle Model Explain the Relation Between Trade and Comovement?" Journal of International Economics, 68(2): 267-295.
Appendix
Data and methods. Quarterly inflation, output gap, supplier delivery times, and oil price data are from Haver Analytics; annual GDP is from Haver Analytics; bilateral portfolio positions are from the IMF Coordinated Portfolio Investment Survey; bilateral intermediate-input trade is from the OECD Inter-Country Input-Output tables (1995 to 2022); and bilateral goods imports by source country (Figure 4) are from UN Comtrade, accessed through the Board's data platform. The New York Fed's Global Supply Chain Pressure Index is a static download. All series except the Comtrade data were retrieved in October 2026 (the Comtrade data in November 2026), and the scripts that produce every number and figure in this note are available on request.
GDP comovement. The 26 economies are Argentina, Australia, Belgium, Brazil, Canada, China, France, Germany, India, Indonesia, Italy, Japan, Mexico, the Netherlands, Poland, Russia, Saudi Arabia, Singapore, South Africa, South Korea, Spain, Sweden, Switzerland, Turkey, the United Kingdom, and the United States. GDP cycles are obtained by applying a Hodrick-Prescott filter (smoothing parameter 100) to annual log real GDP. Because a two-sided filter would spread the 2020 collapse and the 2021 rebound into neighboring years, I first replace 2020 and 2021 log GDP with a log-linear interpolation between 2019 and 2022. Trade flows and GDP are in U.S. dollars, and the OECD tables end in 2022, so the two windows ending in 2023 and 2024 use trade data through 2022 only. Bilateral portfolio investment is the sum of the two countries' positions in each other, and non-positive values, which arise from reporting asymmetries, are set to half the smallest positive value before taking logs.
Inflation. The panel covers Australia, Austria, Brazil, Canada, France, Germany, Greece, Ireland, Italy, Japan, the Netherlands, South Korea, Spain, the United Kingdom, and the United States. Consumer price inflation is the year-on-year change in the OECD price index for private consumption, a consumption-deflator proxy and not headline CPI. Producer price inflation is the year-on-year change in the producer price index. The output gap is a quarterly production-function estimate for Australia, Canada, Japan, the United Kingdom, and the United States; an annual IMF estimate, held constant within the year, for Austria, France, Germany, Greece, Ireland, Italy, the Netherlands, South Korea, and Spain; and, for Brazil, a Hodrick-Prescott filter of log real GDP (smoothing parameter 1,600). Oil price inflation is the year-on-year change in the quarterly average of the spot oil price. The sign of each country's SDT series is set so that the global supply-chain disruption of 2021 shows up as higher stress. The since-2023 sample has 204 country-quarters. Foreign SDT weights are held at their 2022 values after 2022.
Import concentration. Figure 4 uses the value of goods imports by source country from UN Comtrade, for all goods (not only intermediate inputs), as reported by the importing economy, across all customs procedures and modes of transport. World totals, residual groups of countries not elsewhere specified, bunkers, free zones, special categories, and the importing economy itself are dropped, and the shares are computed over the remaining source countries. Taiwan is Comtrade partner code 490. Values for 2019 and 2024 are from annual files. Annual files for 2025 are not yet available for most economies, so the 2025 values are the sum of the monthly files, except for Brazil and Japan, which have annual files; Greece has eleven months. Where both exist (2019 and 2024), the HHI from monthly sums differs from the one from the annual file by less than 0.001, and China's share by at most 0.1 percentage point. Austria has no 2025 data and France only January and February, so neither is shown. Using 2024, the latest year with annual data for all fifteen economies, the HHI is lower than in 2019 in thirteen economies, mostly by small amounts, and higher only in Brazil and Germany, while China's share rises in ten. For 2019 and 2022, the Comtrade HHI is highly correlated with the one computed from the OECD intermediate-input shares (correlation of 0.98 or higher in levels), and its change has the same sign in thirteen of the fifteen economies.
Additional checks. Appendix Table 1 reports two checks on the trade intensity estimates in Figure 3. Dropping the portfolio investment control leaves the full-sample and since-2023 estimates close to the baseline and raises the estimate before 2020 from 0.114 to 0.185. Dropping 2020 to 2022 from every window before computing the correlations leaves the full-sample and pre-2020 estimates close to the baseline, but lowers the since-2023 estimate from 1.029 to 0.890 and widens its standard error from 0.536 to 0.765, so that it is no longer statistically different from zero (p-value of 0.25). The recent strengthening is therefore not robust to this check. Ending the inflation sample in 2025 instead of the second quarter of 2026 gives a since-2023 coefficient on foreign SDT of 0.856 for producer prices (p-value below 0.001) and 0.084 for consumer prices (p-value 0.32).
| Full sample | Before 2020 | Since 2023 | |
|---|---|---|---|
| Baseline (Figure 3) | 0.120** | 0.114** | 1.029* |
| (0.052) | (0.054) | (0.536) | |
| Without the portfolio investment control | 0.138*** | 0.185*** | 1.129** |
| (0.045) | (0.046) | (0.53) | |
| Dropping 2020 to 2022 from every window | 0.138*** | 0.114** | 0.89 |
| (0.051) | (0.054) | (0.765) |
Note: Coefficient on the log of bilateral intermediate-input trade intensity, as in Figure 3, with standard errors clustered by country pair in parentheses. The first row repeats Figure 3. The second row drops the portfolio investment control. The third row computes each ten-year correlation without the years 2020 to 2022. All specifications include country-pair fixed effects and 325 pairs. Observations: 8,287, 6,662, 650 (baseline and third row); 8,450, 6,825, 650 (second row). * p<0.1, ** p<0.05, *** p<0.01.
Source: OECD Inter-Country Input-Output tables; IMF Coordinated Portfolio Investment Survey; Haver Analytics; author's calculations.
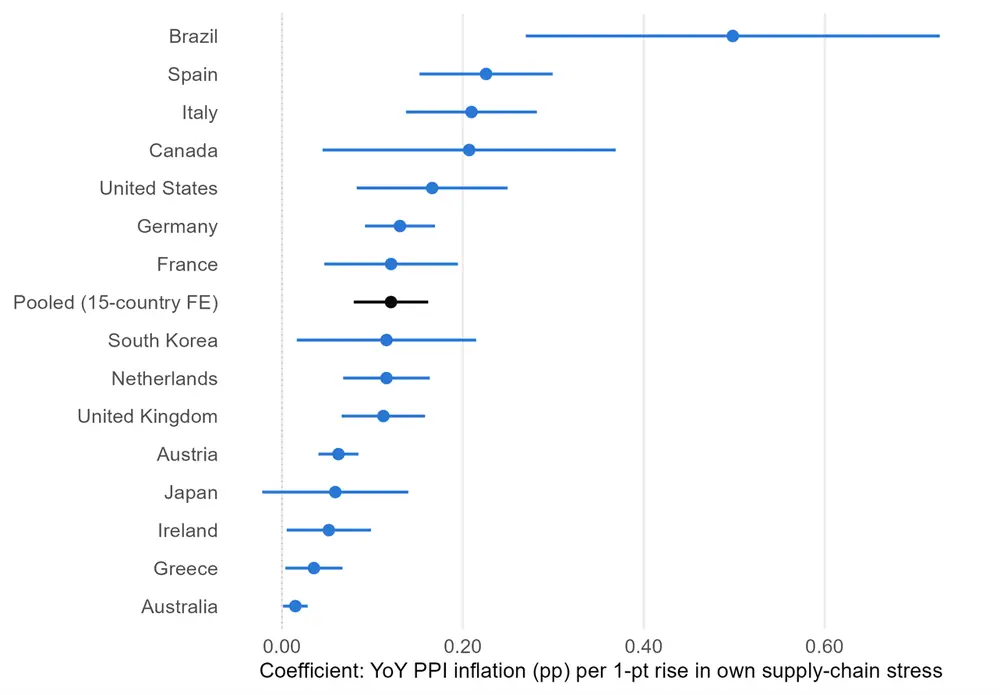
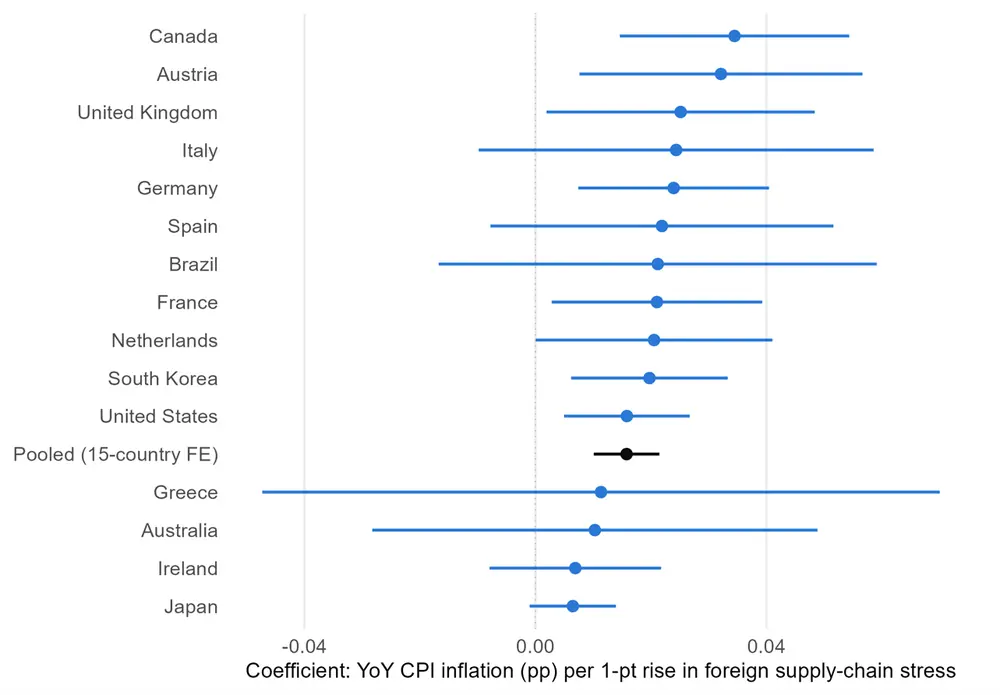
Figure 1A. Own Supply-Chain Stress and Consumer Price Inflation, by CountryFigure 2A. Own Supply-Chain Stress and Producer Price Inflation, by CountryFigure 3A. Foreign Supply-Chain Stress and Consumer Price Inflation, by CountryFigure 4A. Foreign Supply-Chain Stress and Producer Price Inflation, by Country1. François de Soyres is with the Board of Governors of the Federal Reserve System. The views expressed in this note are my own, and do not represent the views of the Board of Governors of the Federal Reserve, nor any other person associated with the Federal Reserve System. Return to text
2. Other work adds a single global shortage or supply-chain pressure index, such as the New York Fed's Global Supply Chain Pressure Index (GSCPI), to the Phillips curve (Benigno et al. 2022; di Giovanni et al. 2022; Bai et al. 2024; De Michelis et al. 2024). Return to text
3. The output gap is the percent deviation of GDP from potential GDP, taken from Haver Analytics. It is a quarterly estimate for Australia, Canada, Japan, the United Kingdom, and the United States, and the annual estimate from the IMF World Economic Outlook, held constant within the year, for Austria, France, Germany, Greece, Ireland, Italy, the Netherlands, South Korea, and Spain. For Brazil, for which no estimate is available, it is a Hodrick-Prescott filter of log real GDP (see Appendix). Return to text
4. The economies are Australia, Austria, Brazil, Canada, France, Germany, Greece, Ireland, Italy, Japan, the Netherlands, South Korea, Spain, the United Kingdom, and the United States. Return to text
5. The shares come from the OECD Inter-Country Input-Output (ICIO) tables. Unlike customs data, which record what crosses the border, the tables separate imports used as intermediate inputs in production from imports bought for final use, cover services as well as goods, and are built on a consistent national-accounts basis across countries. The ICIO tables currently end in 2022, so the weights are held at their 2022 values afterward. Return to text
6. Own and foreign delivery times are correlated within countries, with a correlation of 0.35 before 2020 and 0.83 since 2023. This makes it hard to separate their effects if both are included in the same regression. Return to text
Please cite this note as:de Soyres, Francois (2026). "Increasing International Interdependence: Global Supply Chains and Cross-Border Macroeconomic Spillovers," FEDS Notes. Washington: Board of Governors of the Federal Reserve System, November 20, 2026, https://doi.org/10.17016/2380-7172.4214.
Disclaimer: FEDS Notes are articles in which Board staff offer their own views and present analysis on a range of topics in economics and finance. These articles are shorter and less technically oriented than FEDS Working Papers and IFDP papers.
Back to TopLast Update: November 20, 2026